

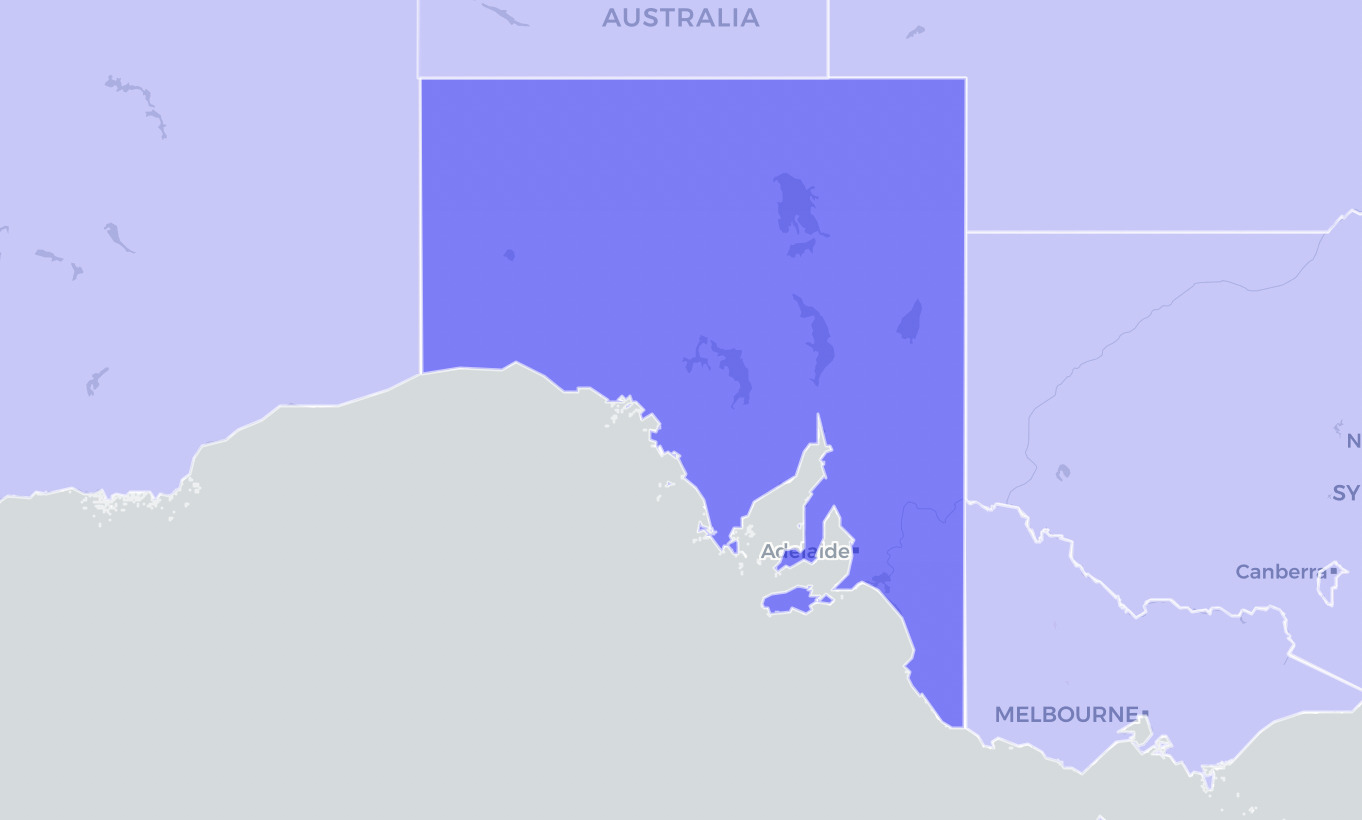
12:06 – This map shows the new, old and draft boundaries for the South Australian redistribution. I’m going to wrap up this live blog now.
Next month I plan to write seat guides for the 18 seats in South Australia, Tasmania and the ACT, to add to the 102 that have already been published. Queensland’s 30 seats will need to wait for next years.
10:30 – I have updated my federal pendulum to reflect the new boundaries for South Australian, Tasmanian and ACT federal electorates. This includes links to my guides that I’ve written so far – I am planning to write guides for these newly-completed electorates in August.
I will put together the interactive map later this morning, but that’s it for now.
| Labor Seats | Coalition Seats | ||
| Seat | Margin | Seat | Margin |
| Bean (ACT) | ALP 0.4% vs IND | Goldstein (VIC) | LIB 0.1% vs IND |
| Bullwinkel (WA) | ALP 0.5% | Longman (QLD) | LNP 0.1% |
| Fremantle (WA) | ALP 0.7% vs IND | Berowra (NSW) | LIB 1.6% |
| Menzies (VIC) | ALP 1.1% | La Trobe (VIC) | LIB 2.1% |
| Petrie (QLD) | ALP 1.2% | Forrest (WA) | LIB 2.2% |
| Solomon (NT) | ALP 1.3% | Flinders (VIC) | LIB 2.3% vs IND |
| Wills (VIC) | ALP 1.4% vs GRN | Bowman (QLD) | LNP 2.4% |
| Bendigo (VIC) | ALP 1.4% | Cowper (NSW) | NAT 2.5% vs IND |
| Forde (QLD) | ALP 1.8% | Lindsay (NSW) | LIB 2.8% |
| Banks (NSW) | ALP 2.4% | Casey (VIC) | LIB 2.9% |
| Deakin (VIC) | ALP 2.8% | Fairfax (QLD) | LNP 3.2% |
| Moore (WA) | ALP 2.9% | Wannon (VIC) | LIB 3.3% vs IND |
| Melbourne (VIC) | ALP 3% vs GRN | Mitchell (NSW) | LIB 3.8% |
| Hughes (NSW) | ALP 3.1% | Monash (VIC) | LIB 4.1% |
| Aston (VIC) | ALP 3.4% | McPherson (QLD) | LNP 4.4% |
| McEwen (VIC) | ALP 4.8% | O’Donoghue (SA) | LIB 4.6% |
| Bonner (QLD) | ALP 5.0% | Groom (QLD) | LNP 5.7% vs IND |
| Calwell (VIC) | ALP 5.1% vs IND | Capricornia (QLD) | LNP 5.8% |
| Gilmore (NSW) | ALP 5.1% | Fisher (QLD) | LNP 6.0% |
| Blair (QLD) | ALP 5.7% | Farrer (NSW) | LIB 6.2% vs IND |
| Chisholm (VIC) | ALP 5.7% | Hinkler (QLD) | LNP 6.3% |
| Dickson (QLD) | ALP 6.0% | Canning (WA) | LIB 6.6% |
| Leichhardt (QLD) | ALP 6.1% | Fadden (QLD) | LNP 6.9% |
| Whitlam (NSW) | ALP 6.2% | Cook (NSW) | LIB 7.2% |
| Pearce (WA) | ALP 6.4% | Wide Bay (QLD) | LNP 7.6% |
| Sturt (SA) | ALP 6.6% | Wright (QLD) | LNP 8.0% |
| Werriwa (NSW) | ALP 6.8% | Hume (NSW) | LIB 8.1% |
| Paterson (NSW) | ALP 6.9% | Moncrieff (QLD) | LNP 8.8% |
| Tangney (WA) | ALP 7.0% | Page (NSW) | NAT 9.3% |
| Dunkley (VIC) | ALP 7.1% | Lyne (NSW) | NAT 9.8% |
| Eden-Monaro (NSW) | ALP 7.2% | Durack (WA) | LIB 10.2% |
| Braddon (TAS) | ALP 7.2% | Flynn (QLD) | LNP 10.2% |
| Hawke (VIC) | ALP 7.6% | Dawson (QLD) | LNP 11.8% |
| Macquarie (NSW) | ALP 7.7% | Riverina (NSW) | NAT 12.6% |
| Corangamite (VIC) | ALP 8.0% | Barker (SA) | LIB 12.7% |
| Bass (TAS) | ALP 8.0% | Parkes (NSW) | NAT 13.0% |
| Lingiari (NT) | ALP 8.1% | O’Connor (WA) | LIB 13.3% |
| Hunter (NSW) | ALP 9% vs ON | Herbert (QLD) | LNP 13.4% |
| Brisbane (QLD) | ALP 9.0% | Nicholls (VIC) | NAT 14.4% |
| McMahon (NSW) | ALP 9.0% | New England (NSW) | NAT 17.1% |
| Fraser (VIC) | ALP 9.2% vs GRN | Mallee (VIC) | NAT 19.0% |
| Bennelong (NSW) | ALP 9.3% | Gippsland (VIC) | NAT 19.4% |
| Dobell (NSW) | ALP 9.4% | Maranoa (QLD) | LNP 20.1% vs ON |
| Robertson (NSW) | ALP 9.4% | ||
| Cooper (VIC) | ALP 9.7% vs GRN | ||
| Richmond (NSW) | ALP 10.0% | ||
| Gorton (VIC) | ALP 10.3% | ||
| Griffith (QLD) | ALP 10.6% vs GRN | ||
| Ballarat (VIC) | ALP 10.7% | ||
| Boothby (SA) | ALP 11.1% | ||
| Shortland (NSW) | ALP 11.5% | ||
| Macnamara (VIC) | ALP 11.8% | ||
| Reid (NSW) | ALP 12.0% | ||
| Parramatta (NSW) | ALP 12.5% | ||
| Maribyrnong (VIC) | ALP 12.6% | ||
| Jagajaga (VIC) | ALP 12.9% | ||
| Lyons (TAS) | ALP 13.1% | ||
| Corio (VIC) | ALP 13.2% | ||
| Lalor (VIC) | ALP 13.2% | ||
| Cowan (WA) | ALP 13.6% | ||
| Greenway (NSW) | ALP 13.8% | ||
| Holt (VIC) | ALP 14.0% | ||
| Swan (WA) | ALP 14.0% | ||
| Isaacs (VIC) | ALP 14.3% | ||
| Scullin (VIC) | ALP 14.3% | ||
| Lilley (QLD) | ALP 14.5% | ||
| Bruce (VIC) | ALP 14.6% | ||
| Makin (SA) | ALP 14.9% | ||
| Gellibrand (VIC) | ALP 15.1% | ||
| Spence (SA) | ALP 15.1% | ||
| Rankin (QLD) | ALP 15.6% | ||
| Macarthur (NSW) | ALP 15.6% | ||
| Burt (WA) | ALP 15.7% | ||
| Newcastle (NSW) | ALP 15.8% vs GRN | ||
| Barton (NSW) | ALP 16.0% | ||
| Hasluck (WA) | ALP 16.0% | ||
| Moreton (QLD) | ALP 16.1% | ||
| Hindmarsh (SA) | ALP 16.3% | ||
| Watson (NSW) | ALP 16.5% vs IND | ||
| Perth (WA) | ALP 16.5% | ||
| Grayndler (NSW) | ALP 16.9% vs GRN | ||
| Brand (WA) | ALP 16.9% | Bradfield (NSW) | IND 0.01% vs LIB |
| Hotham (VIC) | ALP 16.9% | Kooyong (VIC) | IND 0.7% vs LIB |
| Kingsford Smith (NSW) | ALP 17.2% | Fowler (NSW) | IND 2.7% vs ALP |
| Cunningham (NSW) | ALP 17.5% | Curtin (WA) | IND 3.3% vs LIB |
| Tongerlongeter (TAS) | ALP 18.7% | Ryan (QLD) | GRN 3.3% vs LNP |
| Adelaide (SA) | ALP 19.1% | Mackellar (NSW) | IND 5.7% vs LIB |
| Oxley (QLD) | ALP 19.2% | Calare (NSW) | IND 6.8% vs NAT |
| Canberra (ACT) | ALP 19.5% vs GRN | Wentworth (NSW) | IND 8.3% vs LIB |
| Chifley (NSW) | ALP 19.8% | Indi (VIC) | IND 8.6% vs LIB |
| Kingston (SA) | ALP 20.7% | Clark (TAS) | IND 9.2% vs ALP |
| Sydney (NSW) | ALP 20.9% vs GRN | Warringah (NSW) | IND 11.2% vs LIB |
| Blaxland (NSW) | ALP 21.9% | Mayo (SA) | CA 15.3% vs ALP |
| Fenner (ACT) | ALP 22.3% | Kennedy (QLD) | KAP 15.8% vs LNP |
10:20 – This table compares the old and new margins. There is very little change – Mayo becomes 0.4% stronger for Rebekha Sharkie, while Makin and Spence each change by 0.2% and Barker changes by 0.3%. Compared to the draft redistribution, the biggest change is in Grey/O’Donoghue, where the Liberal Party is now 0.4% stronger than they were on the draft boundaries.
| Electorate | Old margin | New margin |
| Adelaide | ALP 19.1% | ALP 19.1% |
| Barker | LIB 13.0% | LIB 12.7% |
| Boothby | ALP 11.1% | ALP 11.1% |
| Hindmarsh | ALP 16.3% | ALP 16.3% |
| Kingston | ALP 20.7% | ALP 20.7% |
| Makin | ALP 14.7% | ALP 14.9% |
| Mayo | CA vs ALP 14.9% | CA vs ALP 15.3% |
| O’Donoghue (Grey) | LIB 4.6% | LIB 4.6% |
| Spence | ALP 15.3% | ALP 15.1% |
| Sturt | ALP 6.6% | ALP 6.6% |
10:15 – This table shows the 2PP and primary vote for each of the new seats. Only Mayo, Spence, O’Donoghue and Kingston should have differed from the draft.
| Electorate | ALP 2PP | LIB 2PP | ALP prim | LIB prim | GRN prim | ON prim | IND prim |
| Adelaide | 69.1 | 30.9 | 46.5 | 24.2 | 19.0 | 4.0 | 0.0 |
| Barker | 37.3 | 62.7 | 22.3 | 47.6 | 8.2 | 8.2 | 5.7 |
| Boothby | 61.1 | 38.9 | 42.0 | 32.0 | 17.1 | 3.1 | 0.0 |
| Hindmarsh | 66.3 | 33.7 | 48.1 | 23.1 | 13.6 | 5.0 | 1.6 |
| Kingston | 70.7 | 29.3 | 53.0 | 18.6 | 13.4 | 6.2 | 0.0 |
| Makin | 64.9 | 35.1 | 47.7 | 22.0 | 12.6 | 6.9 | 0.2 |
| Mayo | 54.8 | 45.2 | 21.1 | 23.6 | 13.5 | 6.0 | 0.0 |
| O’Donoghue | 45.4 | 54.6 | 22.5 | 34.9 | 5.9 | 10.0 | 17.5 |
| Spence | 65.1 | 34.9 | 44.1 | 18.9 | 14.5 | 9.7 | 2.5 |
| Sturt | 56.6 | 43.4 | 35.3 | 34.3 | 15.6 | 3.4 | 7.2 |
10:13 – The original draft redistribution shifted 3.9% of voters – the new version shifts just 1.8%.
10:00 – The Australian Electoral Commission this morning announced the final decision on the federal redistribution of South Australia’s ten electorates.
They have adopted most of the proposed changes, but in two places they will be leaving suburbs in their original seat. A bunch of suburbs swapped between Mayo and Kingston will remain in their 2025 electorate, and the same is true for Grey and Spence. The commission has also adopted the new name of O’Donoghue to replace the seat of Grey.
This is a relatively small chance so it will be possible for me to create a map and data reflecting these changes – something the AEC has not done itself. When that’s done I will share an interactive map, my estimate of seat margins, and an estimate of the pendulum now that the first wave of redistributions has been completed. The Queensland federal redistribution is only commencing now and will take a way to finish.

You definitely need to go to SA to finalise this post.
Tomorrow is the one year since Parliament opened so will be the date for the Queensland apportionment. So the Queensland redistribution won’t be far down the track. It will be a doozy – 8 years since the last one, and with a fair number of seats way over quota and a few way under. The projections will be fascinating.
Based on what has happened previously the apportionment for all states should be in the Government Gazette tomorrow.
It was confirmed by the Government Gazette yesterday that all states keep their current apportionment so Queensland will go into a redistribution for 30 divisions. Big changes on the way.
I’ll do a blog post when we have the projected redistribution numbers for QLD.