NAT 37.86% vs LAB
Incumbent MP
Scott Simpson, since 2011.
Other local MPs
Catherine Delahunty (Green), list MP since 2008.
Geography
North Island. The electorate of Coromandel covers the Coromandel Peninsula, to the east of Auckland, including the town of Thames.
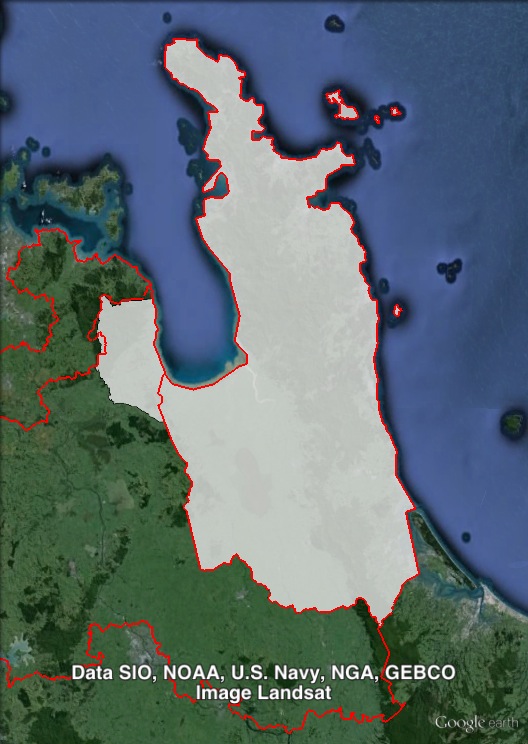
Redistribution
Coromandel’s southern and eastern boundaries were not changed. At the western edge, Coromandel expanded outside of the peninsula to take in a small area on the western side of the Firth of Thames, including Kaiaua and Mangatangi, which was previously part of the Waikato electorate.
History
Coromandel has existed for four different periods: from 1881-1890, 1972-1978, 1987-1993 and since 1996. Since 1972, Coromandel has been won by the National Party at all but one election. The Green Party won their first and only electorate seat in Coromandel in 1999.
In 1987, Coromandel was won by National MP Graeme Lee. He had held Hauraki from 1981 until its abolition in 1987, and this forced Lee to move to the restored seat of Coromandel. He was re-elected in Coromandel in 1990, and in 1993 when Coromandel was abolished he shifted to the seat of Matakana, which existed for only one term.
Lee resigned from the National Party in 1994 and joined the Christian Democrats. He was unsuccessful in running for re-election on the Christian Democrats ticket in 1996.
In 1996, Coromandel was restored, out of parts of Hauraki, Kaimai and Matakana electorates. Originally, the National Party planned to run its sitting Member for Kaimai, Robert Anderson, who had held Kaimai since 1987. Anderson fell ill (and died later in 1996), so the National Party ran Murray McLean.
McLean won Coromandel, with 33.6% of the vote. The parties for both the Alliance (Jeanette Fitzsimons) and New Zealand First (Robyn McDonald) polled over 20% of the vote, and pushed Labour into fourth place, and both Fitzsimons and McDonald won seats in Parliament on their party’s list. Fitzimons came second with over 26% of the vote.
In 1999, Fitzsimons ran in Coromandel for the Green Party. Fitzsimons was co-leader of the Green Party, which had previously run as part of the Alliance. In Coromandel, she narrowly beat the National Party’s Murray McLean, who did not return to Parliament.
In 2002, National’s Sandra Goudie won Coromandel, with Fitzsimons falling to third place behind Labour with 22% of the vote. Fitzimons returned on the Green Party list, and her loss did not result in any loss of ground for the Greens – they increased their number of seats from seven to nine due to an increase in the national list vote.
Goudie was re-elected in Coromandel in 2005 and 2008, and she retired in 2011.
Fitzsimons was re-elected as a list MP in 2005 and 2008. In 2005, she ran again in Coromandel, and in 2008 ran as a list-only candidate. She retired in 2010 after stepping down as co-leader of the Green Party.
In 2011, the National Party’s Scott Simpson won Coromandel. Green Party list MP Catherine Delahunty also ran in Coromandel, and was elected to a second term as a Green list MP. She had first been elected in 2008 after running in East Coast.
Candidates
- Catherine Delahunty (Green #6), list MP.
- Mike Downard (Ban 1080 #1)
- Grant Ertel (New Zealand First #29)
- David Olsen (ACT #14)
- Hiria Pakinga (Māori #17)
- Korbinian Poschl (Labour)
- Scott Simpson (National #45), Member for Coromandel.
- David Walkden (Conservative)
Assessment
Coromandel, on paper, is a very safe National seat. However the centre-left vote is split almost evenly between the two centre-left candidates, and the National majority would be much smaller if those votes were combined behind a single candidate. In addition, National’s vote in the area is at a high watermark. National is not likely to be in significant danger in Coromandel in 2014, but could be vulnerable in the future if the centre-left are in an election-winning position, and coalesce behind a single candidate in Coromandel.
2011 election results
| Electorate Votes | Party Votes | ||||||||
| Candidate | Party | Votes | % | Swing | Redist | Votes | % | Swing | Redist |
| Scott Simpson | National | 18,571 | 55.05 | -8.00 | 55.15 | 18,021 | 52.14 | +0.49 | 52.28 |
| Hugh Kininmonth | Labour | 5,831 | 17.28 | -5.24 | 17.29 | 6,239 | 18.05 | -7.94 | 17.96 |
| Catherine Delahunty | Green | 5,660 | 16.78 | +5.09 | 16.63 | 3,929 | 11.37 | +3.77 | 11.31 |
| Kevin Stone | New Zealand First | 2,118 | 6.28 | +6.28 | 6.31 | 3,813 | 11.03 | +4.70 | 11.04 |
| Hugh Rurehe | Conservative | 853 | 2.53 | +2.53 | 2.55 | 1,349 | 3.90 | +3.90 | 3.90 |
| Jay Fitton | Legalise Cannabis | 454 | 1.35 | +1.35 | 1.32 | 217 | 0.63 | +0.24 | 0.64 |
| Steven Graf | United Future | 195 | 0.58 | +0.58 | 0.57 | 236 | 0.68 | -0.06 | 0.68 |
| Teresa Turner | Independent | 54 | 0.16 | +0.16 | 0.16 | ||||
| ACT | 0.02 | 473 | 1.37 | -3.03 | 1.36 | ||||
| Māori | 151 | 0.44 | -0.30 | 0.43 | |||||
| Mana | 87 | 0.25 | +0.25 | 0.26 | |||||
| Libertarianz | 24 | 0.07 | +0.03 | 0.07 | |||||
| Democrats | 0.01 | 21 | 0.06 | +0.02 | 0.06 | ||||
| Alliance | 4 | 0.01 | -0.07 | 0.01 | |||||
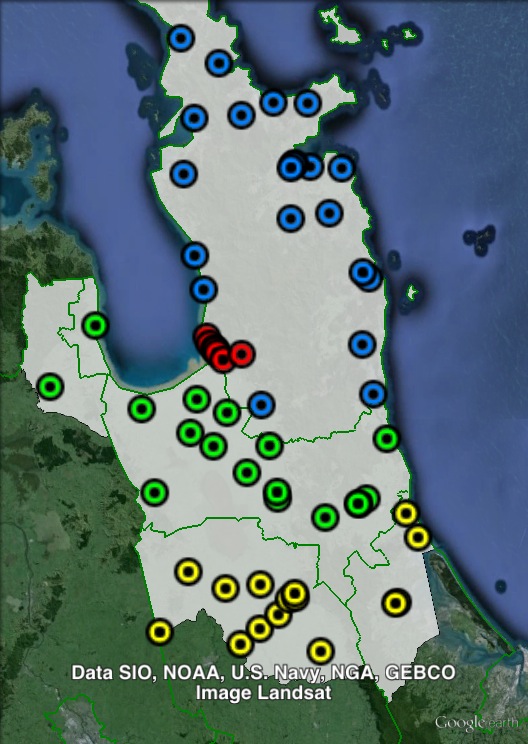
Booth breakdown
Booths in Coromandel have been divided into four areas. Polling places in the Thames-Coromandel council area have been split into two parts. Those polling places in the town of Thames have been grouped under that name. The remainder of the council area, along the peninsula, have been grouped as “North”.
Polling places in Hauraki council area, as well as the single polling place in Waikato council area, have been grouped as “Central”. Those polling places in Matamata-Piako and Western Bay of Plenty council areas have been grouped as “South”.
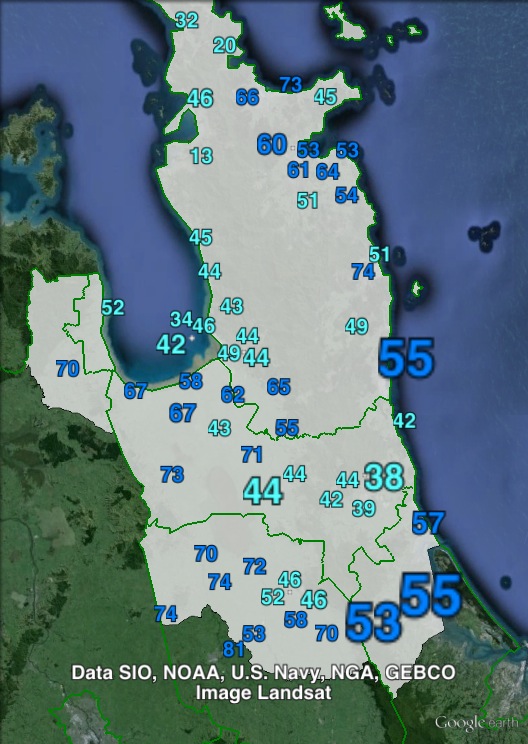
The National Party won the vote in all four areas, with a majority in three areas. The National electorate vote ranged from 45.4% in Thames to 59.6% in the south. The National party vote ranged from 43.2% in Thames to 55.6% in South.
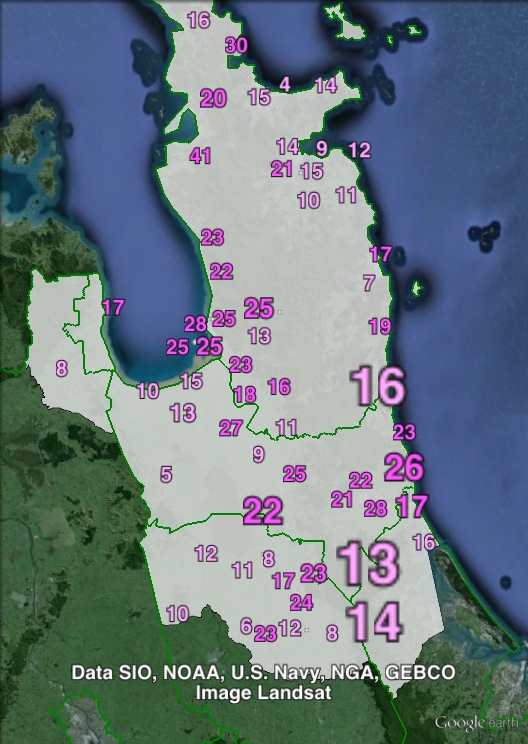
The Labour electorate vote ranged from 14% in the north to 25.2% in Thames, and the party vote ranged from 15.3% in the south to 24.5% in Thames.
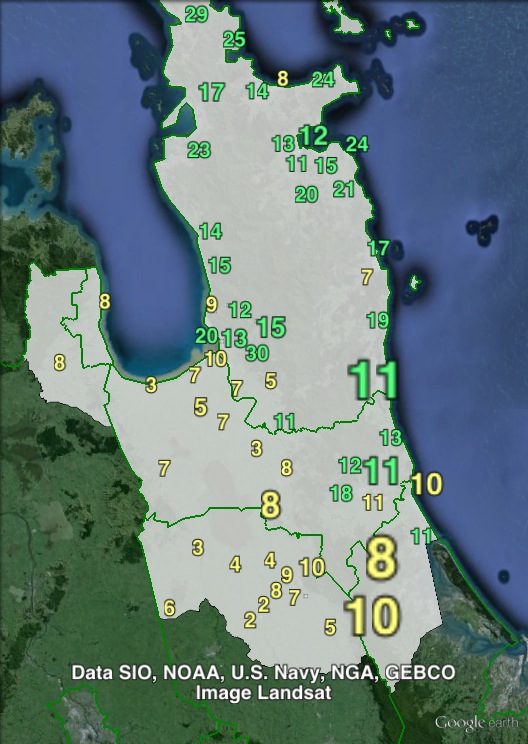
The Green Party’s electorate vote ranged from 12.7% in South to 21% in the North, and the Green candidate overtook the Labour candidate in the north.
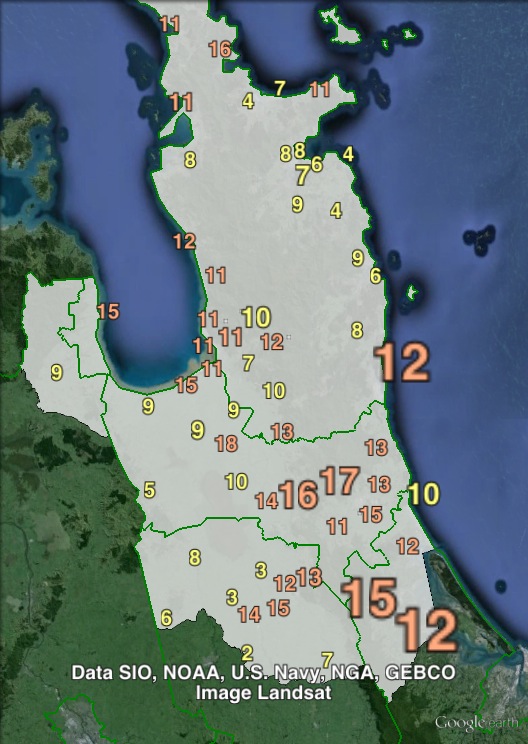
The Green party vote was lower than the party vote, only just ahead of New Zealand First. The Green Party outpolled New Zealand First on the party vote in Thames and North, while New Zealand First outpolled the Green Party in the South and Central.
| Voter group | Electorate votes | Party votes | Total | % of votes | |||||
| NAT | LAB | GRN | NAT | LAB | GRN | NZF | |||
| South | 59.56 | 15.13 | 12.70 | 55.56 | 15.25 | 8.29 | 11.80 | 8,434 | 24.56 |
| North | 56.61 | 13.98 | 21.02 | 54.62 | 15.71 | 13.96 | 9.26 | 7,891 | 22.98 |
| Central | 53.36 | 19.54 | 13.87 | 50.05 | 19.83 | 9.02 | 13.49 | 7,000 | 20.38 |
| Thames | 45.38 | 25.22 | 19.90 | 43.21 | 24.45 | 14.35 | 10.74 | 3,453 | 10.06 |
| Other votes | 54.82 | 17.45 | 17.50 | 52.39 | 18.62 | 12.63 | 9.95 | 7,562 | 22.02 |