
A lot of people would love to know how the electoral map would change if the parliament was expanded.
We’ve already been able to get some idea of what might happen by looking back at the historical experience from the 1948-49 and 1983-84 expansions. But the political system has changed since 1984, as has the map.
So I wanted to try drawing my own map, attempting as best as I can to draw sensible boundaries that fit within population constraints, and then examine what those maps would mean.
I decided to draw a map for a House of 200 seats, which would be achieved by expanding the Senate to 16 senators per state.
I drew the map using two different tools. The Australian Redistribution Tool by JWood (a commenter on this blog), which was inspired by another tool by commenter Angas, is a very easy tool to use, particularly for small jurisdictions. For some of the biggest jurisdictions, I instead chose to use QGIS, with the Statto Redistricter plugin.
Unfortunately I don’t have projection data for most jurisdictions, so I used JWood’s estimates based on the number of votes cast at each SA1 at the 2025 election. I applied the stricter 3.5% allowance. These aren’t exactly the same as the actual numbers that would be used if a parliamentary expansion were to take place in 2026, but it gives us some sense. I also realise that I ended up using the current population numbers, not the projections, for South Australia, as I was used to using those numbers for other states. The whole thing is a thought exercise, but I have applied strict numerical limits regardless.
A lot of caveats are needed. For a start, my map is one of an infinite range of possible maps. I have tried to draw compact and logical maps, but there may be places where others with better local knowledge could draw them better. Where I have created new electorates, I have usually named them after local geography, to understand their location more easily. In a few cases I have resurrected abolished seat names like North Sydney, Higgins and Gwydir. In reality it would be a significant task to identify at least 50 honoured Australians to have new electorates named after them.
The new boundaries are based on combining SA1s, but in some cases a boundary would not follow the SA1 border. To take an example, the national parks to the south of the urbanised Blue Mountains is part of one huge SA1s. So on my map, the southern border of Macquarie runs just to the south of the urbanised part of the Mountains, when in reality it would follow the LGA border.
I should also note that I have not made any changes to Tasmania. We know Tasmania is undergoing a substantial redistribution, but it has nothing to do with the expansion of Parliament.
If the Senate was expanded to 16 senators per state, that would produce the following numbers per state:
- NSW – 62 (+16)
- VIC – 51 (+13)
- QLD – 40 (+10)
- WA – 22 (+6)
- SA – 14 (+4)
- TAS – 5 (-)
- ACT – 4 (+1)
- NT – 2 (-)
The ACT barely qualifies for a fourth seat if the parliament is expanded to this size. The Northern Territory’s two electorates, which are currently some of the smallest seats, would be closer to the average, while Tasmania’s over-representation would be reduced.
This map can be toggled to see the differences between the old and new boundaries.
This next map shows the location of newly created electorates. Understandably, they are spread all over the country.
Each state gained roughly one new seat for every three existing seats. While a lot of these seats are in the big cities, there are plenty of new rural seats too. The largest rural seats have tended to get smaller, but some of them are still quite large.
You can also toggle that map to see which seats are marginal (under 6%) on the actual 2025 map, and on my alternative map. Most of the marginal seats are in similar areas but there is some variation.
So with all these caveats in mind, this is my estimate of how the 200 seats would have split based on my boundaries (using 2025 votes).
The Labor government would hold 120 seats, which is 60% of all seats. That is the equivalent of 90 seats in the current House, so they gain slightly less than their proportionate share.
The Coalition increases from 43 to 62, with the Liberal Party benefiting slightly more than the Nationals.
The Greens and Katter’s Australian Party each gain a second seat, and four extra independents are elected.
Overall the ALP increases their numbers by 27.7%, the Coalition by 44.2%, and the crossbench by 38.5%. It may be that the dominant party just doesn’t end up being quite so over-represented in a larger chamber, but I can’t say that with certainty.
This next chart is a replica of one that I made for the 1948 and 1983 redistributions. It compares the shape of the two-party-preferred vote – as the Coalition 2PP increases, what proportion of the House’s seats would be held by the Coalition on a 2PP basis?
The two lines look very similar, although some of Labor’s safest seats are slightly less safe.
Since the 1980s, politics has moved away from the two-party contest. So this next chart also attempts to map out the distribution of two-candidate-preferred margins.
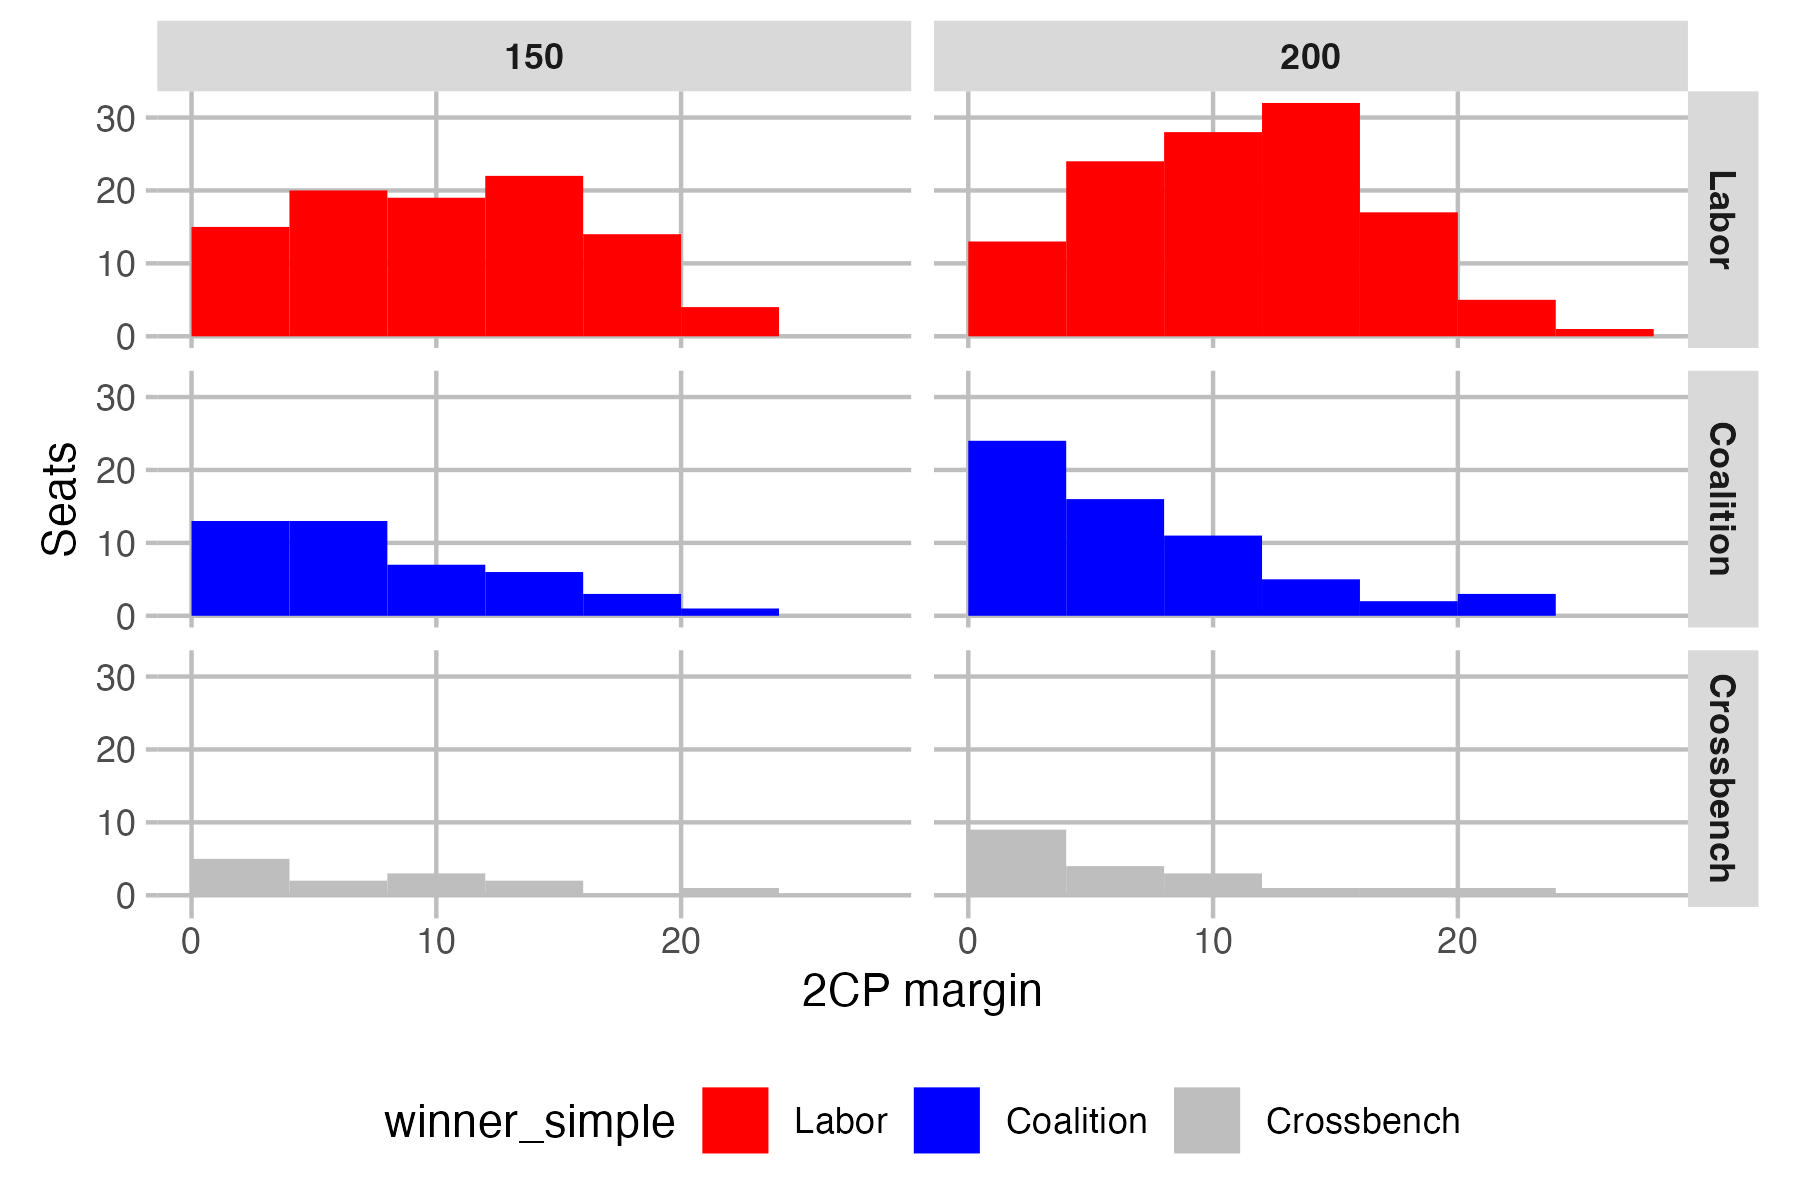
The Coalition accumulates rather a lot of marginal seats, while Labor’s gains are further up the pendulum. Crossbench gains are also in the most marginal seats. This may also explain why Labor’s gains are less than for the other groups.
With the creation of 50 new seats, there is a long list of seats that go to a particular party, and some existing seats flip from one party to another.
- Labor picks up Belconnen, Bankstown, Blacktown, Epping, Glenfield, Illawarra, Lake Macquarie, Pendle Hill, South Sydney, Terrigal, Brisbane East, Deception Bay, Ipswich, McDowall, Yeerongpilly, Mitcham, Prospect, Tea Tree Gully, Belgrave, Caulfield, Dandenong, Fawkner, Frankston, Nillumbik, South Barwon, Sunbury, Wyndham, Cockburn, Kalamunda, Kwinana, Stirling and Wanneroo
- The Liberal Party picks up Camden, Hawkesbury, Gawler, Cardinia, Higgins, Murrindindi and South-West
- The Nationals pick up Coffs Harbour, Goulburn, Great Lakes, Gwydir and Loddon
- The LNP picks up Buderim, Burnett, Lockyer and Southport
- Independents pick up North Sydney
- Katter’s Australian Party pick up Mount Isa
Seven seats flip between parties:
- Independents pick up Bean and Fremantle from Labor, and Lyne from the Nationals (although the winner is the former Cowper candidate)
- The Greens pick up Wills from Labor
- The Coalition picks up Hughes, Forde and Bendigo from Labor
While some MPs may see their seat flip under their feet, there is usually another nearby seat for them to jump into. The Labor MPs for Wills, Hughes, Forde and Fremantle would have the option of moving to Fawkner, Glenfield, Brisbane East and Cockburn, and the Nationals MP for Lyne could move to Great Lakes. There would be no nearby Labor seat near Bendigo, and it’s unlikely the Labor member for Bean would jump to the new seat of Belconnen. But overall, MPs would have a lot more options, with many having a choice of moving to a new seat.
To give some examples:
- The seat of Banks becomes substantially safer, but the local MP could also jump to the much safer seat of Bankstown, which takes in a big part of Banks.
- The Labor MPs for Menzies, Deakin and Aston would have the option of moving to Nillumbik or Belgrave.
- The Liberal member for La Trobe could switch to the slightly safer seat of Cardinia.
- The Labor member for Sturt could switch to Tea Tree Gully.
- The Labor member for Moore could switch to Stirling or Wanneroo.
Finally, you can see the partisan distributions on this next map, and you can toggle between the 150-seat and 200-seat map.
The parliamentary expansion doesn’t radically reshape the map. The Liberal Party’s problems in urban Australia don’t go away. They do pick up the seats of Higgins and Hughes, and a new seat in each of the Gold Coast and Sunshine Coast, but mostly Labor and crossbench domination of the big cities remains.
Once again I should emphasise that all of this is hypothetical – the precise population numbers won’t be what I have used, and the mapmakers will likely make many different decisions. But I think this exercise gives a sense of what may happen if parliament was expanded.

@ Votante
Regarding a Proposed Higgins
If the eastern part of Glen Eira (East of Booran Road) is included it lifts the Labor PV as it middle class so ideally Libs dont want that.
Parts of Glen Eira like Caulfield are good for Libs but the Southern Borondoora portion which is part of Ben’s proposed Higgins is even stronger and wealtier so i think Libs would prefer a Higgins that does not go South of Dandenong Road. Also now Metro Tunnel is open i think Murrumbeena, Stronnington have less of a community interest as they are on Seperate lines while Glen Iris is better connected to Malvern,Armadale etc
I would love to see the new 3cp for Page, having gained ballina. The greens did not lose out in Richmond as I thought that they would. It would be fascinating to see the Greens end up with two northern NSW seats.
As a result of more coastal electorates, Hunter would be moved inland and away from Lake Macquarie. The proposed Hunter (with Upper Hunter and Muswellbrook) would make it more competitive. The Nats and One Nation would be in within striking distance. A caveat is that the latest booth results for Upper Hunter and Muswellbrook were probably inflated by Barnaby Joyce who ran for the Nats. I’d like to know the 3CP result for the proposed Hunter.
I was surprised that the proposed Page would be marginal Nationals but then I realised it’s because the northern parts – Lismore and Ballina LGAs, have a strong Greens vote.
The Page 3CP is easy to calculate since Page and Richmond had the same 3CP combo.
NAT 48.1%
ALP 28.3%
GRN 23.6%
@Ben Raue Sorry about the delay Ben, knocking through a supplementary submission to JSCEM. As an aside there are some pretty deep submissions on how the Senate vote is counted – Antony Greens is a masterpiece.
The biggest single change that needs to be made to North Queensland is to drag the northern section of Leichardt across to Kennedy and break every single attachment Kennedy has with the Eastern coastline.
My proposed changes for Queensland are probably going to be more radical than the 2007 redistribution, especially for Brisbane…
The new ABS data out today suggest that Queensland will not gain enough population to get the magical 31st seat. Seems stuck – even with another six months to go at 30.4 quotas.
Interesting how many NSW lost due to interstate migration over 20,000 down compared to 777 for Victoria
Some name ideas for new WA seats
Yagan – famous Noongyar Warriror
Daglish – Henry Daglish first Labor premier of WA
Hackett – Deborah Hackett early 20th century community worker
Black – David Black famous WA political science professor
Wallam – Angus Wallam local Noonyar man who work with First Nations youth
Rocher – Liberal tuned Independent MP for Curtin former US Consulate member
A couple of days ago our population hit 28 million. At Federation our population was actually 3.8 million. While the size of parliament has doubled from 75 lower house seats to 150 the populaiton has grown 7 fold. I personally belive 2031 will be when parliament is expanded as on current projections the population would have reached 30 million which is a doubling from the 1984 population when parliament was last expanded.
I would suspect that there is less appetite than ever for an increase in the size of the parliament. The situation may become more clear after 2028. In the foreseeable future with potential electoral outcomes being so fluid with the rise of One Nation, there is no saying where it could all end up. None of the existing major parties want to see a whole lot of vacant seats where ON would be the genie that comes out of lots of bottles. Labor have increased the size of the parliament twice – in 1948 and 1984 – and in neither case did it end up particularly well for them. What would have been interesting is if Labor had legislated a parliament size increase last year. Internally they would now be running around like headless chooks saying WTF have we done?
Given the significant distrust towards politicians this is the last thing the current federal government will want to tackle, Labor has already had skin taken off its noise from the recent budget and the cost of living is seriously biting them in the out suburbs. I don’t expect parliament to be expanded while Labor is government in fact it could be some decades before it’s even touched.
Comments are closed.