April 5, 2014
At the 2013 federal election, the result in Western Australia was extremely close. At a key point, the lead candidates for the Australian Christians and the Shooters and Fishers were very close, and the order in which they were eliminated would determine who won the final two seats in the count.
If the Shooters and Fishers came out on top, the final two seats would have been won by the second Labor candidate, and the lead candidate for the Palmer United Party. If the Australian Christians led the Shooters, the final two seats would have been won by the candidates of the Greens and the Australian Sports Party.
On the original count, the Shooters and Fishers led the Australian Christians by 14 votes. A recount was called due to the narrow margin.
During the recount, a batch of 1370 votes from four regional polling places went missing, and the result saw the Australian Christians come out ahead by 12 votes. It is estimated that, if those 1370 votes were not lost and were included based on the original count, then the Shooters and Fishers would have outpolled the Australian Christians by one vote.
The result was appealed to the Court of Disputed Returns, and the result was voided, thus requiring a new election.
This is the first by-election for the Senate in over one hundred years.
Incumbent Senators
| Mark Bishop (ALP) | David Johnston (LIB) |
| Michaelia Cash (LIB) | Scott Ludlam (GRN) |
| Alan Eggleston (LIB) | Louise Pratt (ALP) |
Electorate profiles
Western Australia is covered by fifteen electorates. While the Senate election will take place across the entire state, each seat has a different balance of votes for each party.
Each profile covers the geography of the electorate, the votes for each party in that seat at the 2013 election, and maps of the results in the Senate at the 2013 election by booth for all parties that polled over 5% in that seat.
| Brand | Forrest | Pearce |
| Canning | Fremantle | Perth |
| Cowan | Hasluck | Stirling |
| Curtin | Moore | Swan |
| Durack | O’Connor | Tangney |
History
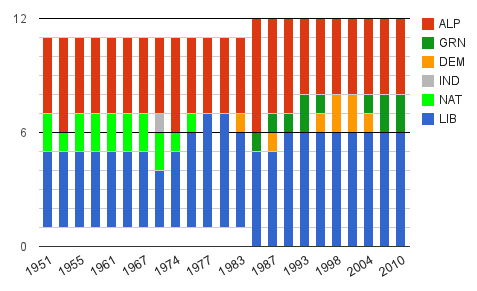
Western Australian Senate races were dominated by the Coalition from 1951 until the beginning of the 1980s. The 1951 election produced a result of four ALP senators, four Liberal senators and two Country Party senators. The 1953 election saw the ALP win a seat off the Country Party, but the previous result was restored in 1955. The 4-4-2 result was maintained at every election throughout the 1950s and 1960s. The 1970 Senate election saw the Liberal Party lose one of its four seats to independent Syd Negus, who was elected on a platform of abolishing death duties.
The 1974 double dissolution saw Negus defeated and the Country Party lose one of its two seats. The result saw five Labor senators alongside four Liberals and one Country senator. The 1975 double dissolution saw the Coalition regain its majority in Western Australia, with the ALP losing its fifth senate seat to the Liberals. The 1977 election saw the National Country Party lose its senate seat to the Liberals, producing a result of six Liberals and four Labor senators.
The 1983 double dissolution saw the Liberals lose their majority, with five Liberals, four Labor and one Democrat elected. The 1984 election saw Labor gain both new Senate seats while the Democrats lost their seat. In addition to 6 ALP and 5 Liberal, the Nuclear Disarmament Party’s Jo Vallentine was elected. At the 1987 double dissolution, Vallentine was re-elected as an independent along with a Democrat and five each for the two major parties.
The 1990 election saw the Liberals win six seats, along with five Labor and the re-elected Vallentine, who was re-elected as a Green. The Liberals have maintained six WA seats ever since. The 1993 election saw the Greens win a second seat off the ALP. From 1993 until today, WA has been represented by six Liberals, four Labor senators and two minor party Senators from the Greens or Democrats.
In 1996, the Greens lost one of their seats to the Democrats, losing their other seat in 1998. The Democrats held onto their seat in 2001 before losing one of their seats in 2004. The last Democrat was defeated by the Greens candidate in 2007.
The 2010 election was a status quo result. It was the third election in a row which saw three Liberals, two Labor and one Green elected.
The 2013 election was the most complicated and unusual election in Western Australian history, with two seats decided by a 14-vote margin between two candidates who weren’t in a position to win, a statewide recount, a new result and a batch of lost votes, and eventually the result being voided for the Court of Disputed Returns, triggering the first Senate by-election since 1907.
2013 result
| Group | Party | Votes | % | Swing | Quota |
| AA | Liberal | 513,639 | 39.20 | -3.79 | 2.7440 |
| Z | Australian Labor Party | 348,401 | 26.59 | -3.11 | 1.8613 |
| S | The Greens (WA) | 124,354 | 9.49 | -4.47 | 0.6643 |
| U | The Nationals | 66,421 | 5.07 | 1.64 | 0.3548 |
| F | Palmer United Party | 65,595 | 5.01 | 5.01 | 0.3504 |
| B | Liberal Democrats | 44,902 | 3.43 | 2.25 | 0.2399 |
| C | Australian Christians | 21,499 | 1.64 | -0.16 | 0.1149 |
| I | Sex Party | 19,519 | 1.49 | -0.76 | 0.1043 |
| D | Help End Marijuana Prohibition (HEMP) Party | 13,973 | 1.07 | 1.07 | 0.0746 |
| G | Shooters and Fishers | 13,622 | 1.04 | 0.44 | 0.0728 |
| L | The Wikileaks Party | 9,767 | 0.75 | 0.75 | 0.0522 |
| T | Animal Justice Party | 9,720 | 0.74 | 0.74 | 0.0519 |
| N | Family First Party | 8,783 | 0.67 | -0.48 | 0.0469 |
| A | Smokers Rights | 8,719 | 0.67 | 0.67 | 0.0466 |
| W | Australian Motoring Enthusiast Party | 7,748 | 0.59 | 0.59 | 0.0414 |
| V | Australian Fishing and Lifestyle Party | 5,729 | 0.44 | 0.44 | 0.0306 |
| K | Australian Independents | 4,041 | 0.31 | 0.31 | 0.0216 |
| M | Katter’s Australian Party | 3,909 | 0.30 | 0.30 | 0.0209 |
| Y | Rise Up Australia Party | 3,861 | 0.29 | 0.29 | 0.0206 |
| R | Australian Democrats | 3,841 | 0.29 | -0.09 | 0.0205 |
| X | Australian Sports Party | 2,997 | 0.23 | 0.23 | 0.0160 |
| Q | Stop The Greens | 2,215 | 0.17 | 0.17 | 0.0118 |
| J | Secular Party of Australia | 1,486 | 0.11 | 0.11 | 0.0079 |
| O | No Carbon Tax Climate Sceptics | 1,481 | 0.11 | -0.05 | 0.0079 |
| P | Stable Population Party | 1,352 | 0.10 | 0.10 | 0.0072 |
| E | Socialist Equality Party | 1,143 | 0.09 | 0.09 | 0.0061 |
| H | Australian Voice Party | 1,139 | 0.09 | 0.09 | 0.0061 |
| One Nation | 422 | 0.03 | -0.59 | 0.0023 |
Preference flows at the 2013 election
The recount produced a different outcome at a key point, so the late stages of the preference flows worked out quite differently.
Antony Green in early October laid out the preference distribution from the original count.
In both counts, preference flows followed the same pattern for the first 141 counts, leading up to the point where the Australian Christians and the Shooters and Fishers were the last two remaining candidates.
The most interesting part of this story is how the Australian Sports Party managed to overtake eleven parties to get to that point. Antony Green has laid out the path to victory for the Sports Party’s Wayne Dropulich on his blog.
The following information shows the preference flows from the point at which the Shooters and Fishers were excluded to the end of the count. Prior to this point, only three candidates have been elected – the first two Liberals and the first Labor candidate.
In the recount, the key round looked like this:
- Pratt (ALP) – 0.87 quotas
- Reynolds (LIB) – 0.75
- Ludlam (GRN) – 0.68
- Zhang (PUP) – 0.37
- Wirrpanda (NAT) – 0.36
- Fryar (LDP) – 0.31
- Balderstone (HEMP) – 0.22
- Dropulich (SPRT) – 0.18
- van Burgel (AUC) – 0.13
- Bow (SFP) – 0.13
The Shooters and Fishers candidate, Bow, fell behind the Australian Christians’ van Burgel by 12 votes. A majority of Shooters preferences flowed to Dropulich of the Sports Party, pushing him ahead of HEMP:
- Pratt (ALP) – 0.87
- Reynolds (LIB) – 0.75
- Ludlam (GRN) – 0.69
- Zhang (PUP) – 0.38
- Wirrpanda (NAT) – 0.36
- Fryar (LDP) – 0.31
- Dropulich (SPRT) – 0.26
- Balderstone (HEMP) – 0.23
- van Burgel (AUC) – 0.16
Van Burgel’s exclusion pushed Dropulich ahead of all other minor party candidates:
- Pratt (ALP) – 0.87
- Reynolds (LIB) – 0.75
- Ludlam (GRN) – 0.69
- Dropulich (SPRT) – 0.41
- Zhang (PUP) – 0.38
- Wirrpanda (NAT) – 0.36
- Fryar (LDP) – 0.32
- Balderstone (HEMP) – 0.23
HEMP’s exclusion mostly favoured Dropulich:
- Pratt (ALP) – 0.87
- Reynolds (LIB) – 0.75
- Ludlam (GRN) – 0.69
- Dropulich (SPRT) – 0.62
- Zhang (PUP) – 0.38
- Wirrpanda (NAT) – 0.37
- Fryar (LDP) – 0.32
The LDP’s one third of a quota mostly flowed to the Sports Party, putting Dropulich at the top of the pile:
- Dropulich (SPRT) – 0.93
- Pratt (ALP) – 0.87
- Reynolds (LIB) – 0.76
- Ludlam (GRN) – 0.69
- Zhang (PUP) – 0.38
- Wirrpanda (NAT) – 0.37
The exclusion of David Wirrpanda elected the Liberal Party’s third candidate.
- Reynolds (LIB) – 1.10
- Dropulich (SPRT) – 0.93
- Pratt (ALP) – 0.87
- Ludlam (GRN) – 0.70
- Zhang (PUP) – 0.39
Reynolds’ surplus elected the Sports Party’s Dropulich, and his small surplus flowed to the Palmer United Party:
- Pratt (ALP) – 0.87
- Ludlam (GRN) – 0.70
- Zhang (PUP) – 0.42
Preferences flowed from the Palmer United Party mostly to the Greens, electing Scott Ludlam to the final seat.
77 candidates have nominated, an increase from 62 who ran in last September’s election.
These candidates are running in 35 groups, as well as two ungrouped independents. All but one of the groups is being run by a political party.
In comparison, 27 groups and one ungrouped independent nominated for the 2013 election.
The following table provides the name of the lead candidate for all groups. With the exception of the two major parties, no other party has a serious prospect of getting any candidate other than their first candidate elected.
The Liberal Party’s first three candidates are:
- David Johnston
- Michaelia Cash
- Linda Reynolds
The Australian Labor Party’s first three candidates are:
- Joe Bullock
- Louise Pratt
- Shane Hill
| Group | Lead Candidate | Party |
| A | Tibor Meszaros | The Wikileaks Party |
| B | Shane Van Styn | The Nationals |
| C | Russell Woolf | Independent |
| D | Chris Fernandez | Australian Democrats |
| E | Fletcher Boyd | Pirate Party |
| F | Joe Bullock | Australian Labor Party |
| G | Richie Howlett | Australian Motoring Enthusiast Party |
| H | Bill Koutalianos | Freedom and Prosperity Party |
| I | Philip Nitschke | Voluntary Euthanasia Party |
| J | Jim Fryar | Liberal Democrats |
| K | Brian Parkes | Australian Voice Party |
| L | Ken Bezant | Building Australia Party |
| M | Anthony Fels | Mutual Party |
| N | Linda Rose | Family First Party |
| O | Peter Strachan | #Sustainable Population Party |
| P | Zhenya Wang | Palmer United Party |
| Q | Wayne Dropulich | Australian Sports Party |
| R | David Johnston | Liberal |
| S | Murray Bow | Shooters and Fishers |
| T | James M Moylan | Help End Marijuana Prohibition (HEMP) Party |
| U | Marcus Anderson | Republican Party of Australia |
| V | Max Katz-Barber | Smokers Rights |
| W | Daniel Mccarthy | Australian Fishing and Lifestyle Party |
| X | Ray Moran | Australian Christians |
| Y | Simon Cuthbert | Secular Party of Australia |
| Z | Jane Foreman | Rise Up Australia Party |
| AA | Scott Ludlam | The Greens (WA) |
| AB | Adrian Good | DLP Democratic Labour |
| AC | Phillip Bouwman | Katter’s Australian Party |
| AD | Katrina Love | Animal Justice Party |
| AE | Fiona Patten | Sex Party |
| AF | Alex Bainbridge | Socialist Alliance |
| AG | David Fishlock | Outdoor Recreation Party (Stop The Greens) |
| Teresa Van Lieshout | Independent | |
| Kim Mubarak | Independent |
Assessment
The next WA Senate election will not look like the last. While the final two seats were decided by narrow preference flows and saw the potential election of a candidate on an extremely slim vote, those preference flows will be different at the next election, and will be mostly affected by shifts in the votes going to those parties that earn a significant proportion of the vote.
Five parties polled over 5% of the vote: the Liberal Party, the ALP, the Greens, the Palmer United Party and the Nationals. All five of these parties will have a serious chance of winning election.
The Liberal Democratic Party also polled a substantial 3.4% of the vote, on a ballot where they appeared second and the Liberal Party was right at the end. Presumably they benefited from voters confusing them with the Liberal Party, which could happen again, and be possibly a stronger factor, if they draw a position at the top of an even bigger ballot.
The majority of seats will go to the major parties immediately on primary votes. The Liberal Party will easily poll enough to elect their first two candidates. Polling has been limited in Western Australia, but it suggests that the ALP has recovered ground since September, and the Liberal vote has dropped. If so, the ALP should be able to pull together enough votes to win two seats on primary votes, or with a small number of preferences.
The last federal Newspoll for Western Australia had the combined Labor and Greens vote above 43%, with the Liberal vote down on 41%, and with a large vote for ‘others’. If this was carried out, and the ALP and Greens swap preferences (which is by no means guaranteed), it would see the ALP win two seats, the Greens win one, the Liberal Party win two and the third Liberal in a contest with the PUP, Nationals and any fortunate microparty candidate for the final seat.
It is impossible to predict which microparty may come out on the top of the pile. It will depend on primary votes, and on the preference arrangements yet to be announced. With so much more attention focused on Western Australia, it wouldn’t be surprising if the preference arrangements were even more complex and could result in another party with a very small vote, like the Australian Sports Party, to become a contender.
Early news on the ballot is that there will be 77 candidates, up from 62 at the original poll.
The ballot draw assigned the following columns to the biggest vote-getters from 2013:
* Nationals 2
* Labor 6
* Liberal Democrats 10
* Palmer United 16
* Liberals 18
* Greens 27
My coverage is at:
http://kevinbonham.blogspot.com.au/2014/04/wa-senate-take-two-preview-live.html
I did a predicated count ealier in the week.
My predication based on the poll Newspoll results from earlier and accounting for the larger Senate figures state Liberals, 3 ( Nationals and Liberals are giving each other their 2nd preferences), 1 Greens, and proberly 2 ALP.
Why does it take so long to get a result. Surely some improvements can be made in this modern age?
The below-the-line ballots have to be carefully checked for formailty and data-entered. We have to wait a few days for the last postal ballots to come in anyway.
Does it really matter? These senators-elect won’t take their seats until July 1 regardless, there’s no rush.
There is an error in the historical record. At the 1983 election there were five ALP, four Liberals and a Democrat. At the 1984 half-senate poll the Liberal Party and the ALP each gained an extra seat while the Democrat was defeated by Jo Vallentine. Since 1990 there have been 6 Liberal and 4 ALP Senators with the remaining two positions filled by Democrats and/or Greens.