Geography
Western Perth. Curtin covers those suburbs between the northern shore of the Swan River and the Indian Ocean, stretching east to just outside of the Perth CBD. Curtin stretches as far north as Doubleview and Joondanna. Key suburbs include Churchlands, Leederville, Wembley, Jolimont, Subiaco, Kings Park, Nedlands, Claremont, Swanbourne, Mount Claremont, Karrakatta, Floreat, Cottesloe, Peppermint Grove and Mosman Park.
2013 result
| Group | Party | Votes | Curtin % | Statewide % |
| AA | Liberal | 45,786 | 52.88 | 39.20 |
| Z | Australian Labor Party | 13,682 | 15.80 | 26.59 |
| S | The Greens (WA) | 13,627 | 15.74 | 9.49 |
| U | The Nationals | 2,732 | 3.16 | 5.07 |
| B | Liberal Democrats | 2,261 | 2.61 | 3.43 |
| F | Palmer United Party | 1,854 | 2.14 | 5.01 |
| I | Sex Party | 993 | 1.15 | 1.49 |
| L | The Wikileaks Party | 877 | 1.01 | 0.75 |
| Others | 4,777 | 5.52 | 8.98 |
Curtin is very strong for the Liberal Party, who won 52.9% of the vote in the seat. The ALP came second, just narrowly outpolling the Greens by 55 votes. Overall the seat was well above average for the Liberal Party and the Greens, and more than 10% below average for the ALP.
The Nationals came fourth with 3.2%, compared to a statewide of just over 5%. The Liberal Democrats came fifth, and the Palmer United Party came sixth, with much less than half of their statewide figure of 5%.
Booth breakdown
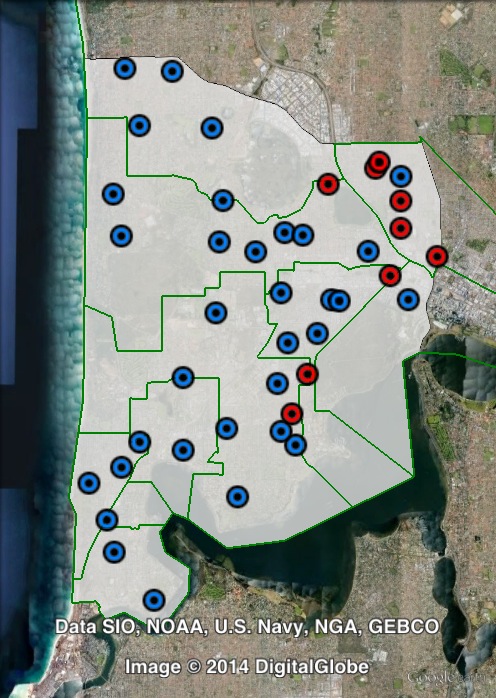
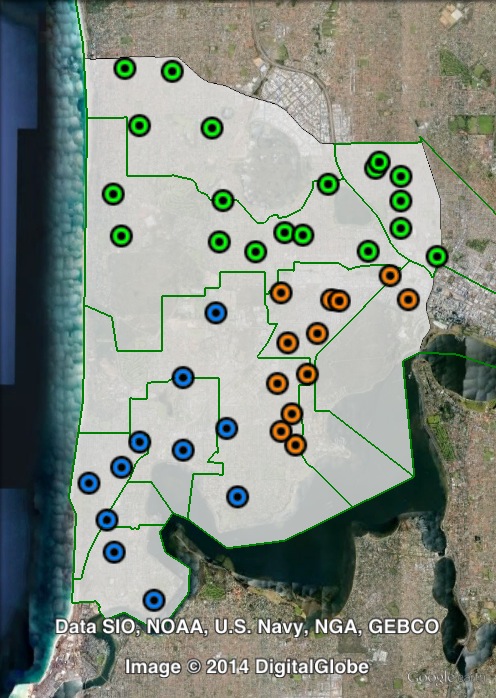
Booths have been divided into three areas: north, south-east and south-west.
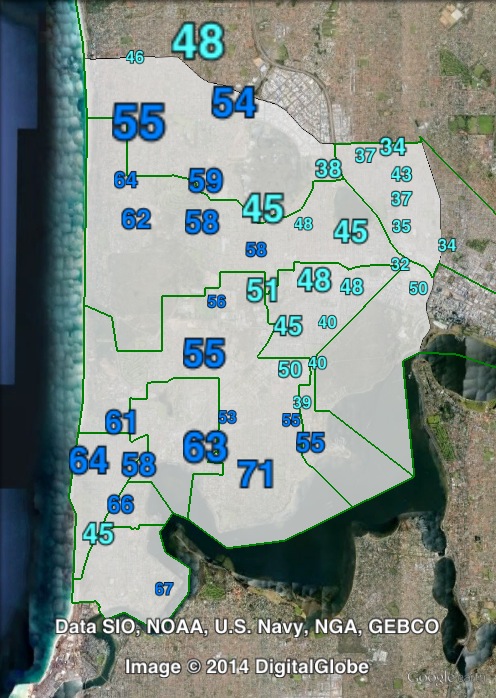
The Liberal Party topped the poll in all three areas. The Liberal Party won a large majority with 60.4% of the vote in the south-west of the seat.
The Liberal Party fell just short of a majority in the north (49.2%) and the south-east (48.6%).
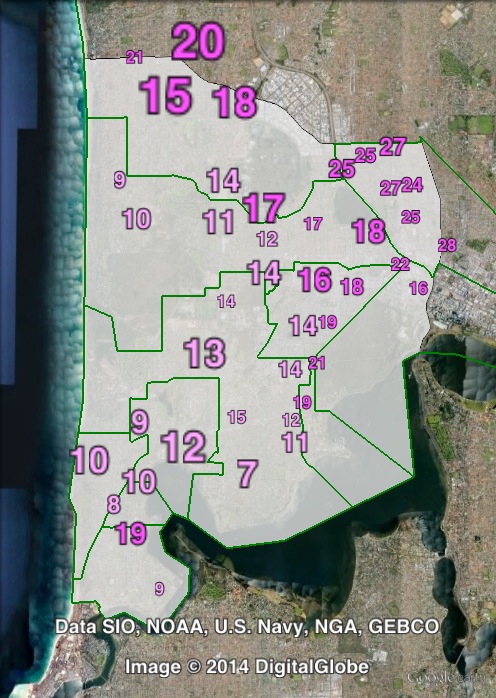
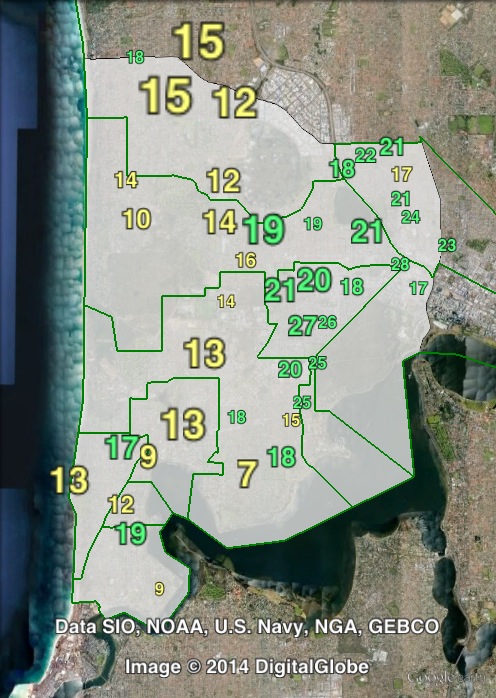
The ALP came second, with 18.1%, in the north, which makes up close to half of the ordinary votes. The Greens came second in the south-east and south-west. The Greens vote peaked at 20.7% in the south-east of the seat.
The Liberal vote is stronger in the west of the seat, closer to the coastline. The Greens vote is stronger in the east of the seat, and the ALP’s vote peaked at the northern end of the seat.
| Voter group | LIB % | ALP % | GRN % | Total votes | % of votes |
| North | 49.19 | 18.11 | 16.49 | 30,825 | 35.60 |
| South-West | 60.44 | 11.12 | 13.71 | 18,965 | 21.90 |
| South-East | 48.55 | 14.88 | 20.66 | 13,146 | 15.18 |
| Other votes | 54.03 | 17.07 | 13.64 | 23,653 | 27.32 |