Geography
South of Perth. Canning covers urban fringe and rural areas to the south of Perth, including most of the Peel region. Canning covers the City of Armadale on the edge of Perth as well as the local government areas of Boddington, Murray, Serpentine-Jarrahdale and Waroona in the Peel region. Canning also covers most of the coastal City of Mandurah.
2013 result
| Group | Party | Votes | Canning % | Statewide % |
| AA | Liberal | 34,752 | 38.11 | 39.20 |
| Z | Australian Labor Party | 24,809 | 27.20 | 26.59 |
| F | Palmer United Party | 6,481 | 7.11 | 5.01 |
| S | The Greens (WA) | 6,231 | 6.83 | 9.49 |
| B | Liberal Democrats | 3,721 | 4.08 | 3.43 |
| U | The Nationals | 2,716 | 2.98 | 5.07 |
| C | Australian Christians | 2,530 | 2.77 | 1.64 |
| I | Sex Party | 1,527 | 1.67 | 1.49 |
| G | Shooters and Fishers | 1,342 | 1.47 | 1.04 |
| D | Help End Marijuana Prohibition (HEMP) Party | 1,052 | 1.15 | 1.07 |
| Others | 6,035 | 6.62 | 5.98 |
The Liberal Party topped the poll in Canning, with a vote 1.1% below the statewide figure. The ALP’s vote was 0.6% ahead of the statewide Labor vote.
The Palmer United Party came third, with a vote 2.1% ahead of the WA total. The Greens came fourth, with 6.8% of the vote, over 2.6% below the statewide total.
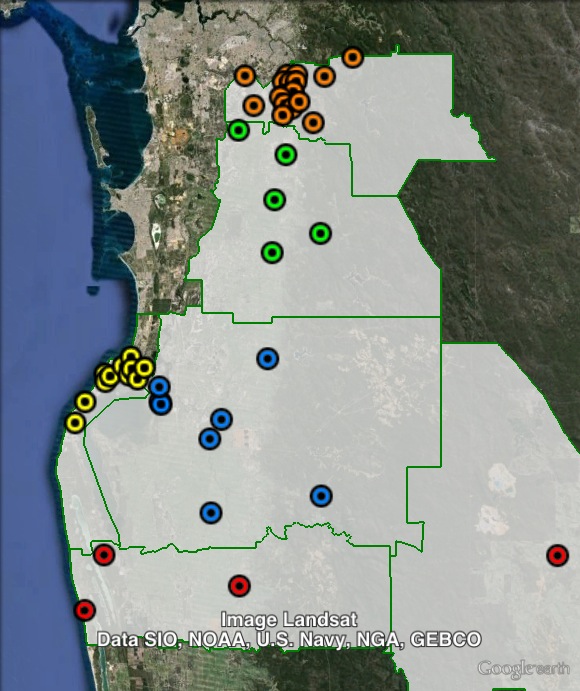
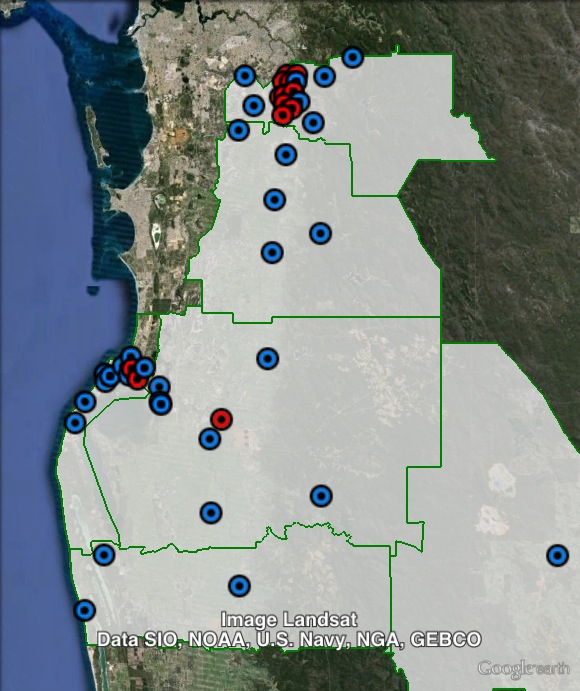
Booth breakdown
Booths have been divided into five areas, based on local government boundaries. The two southernmost council areas have been grouped together.
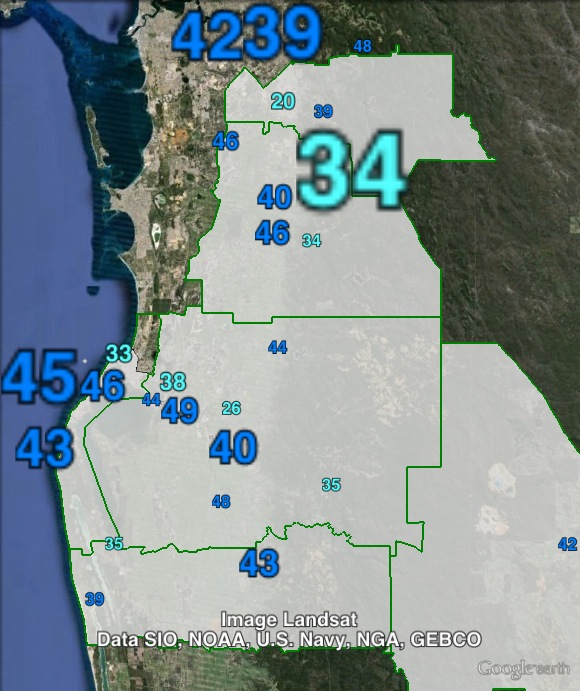
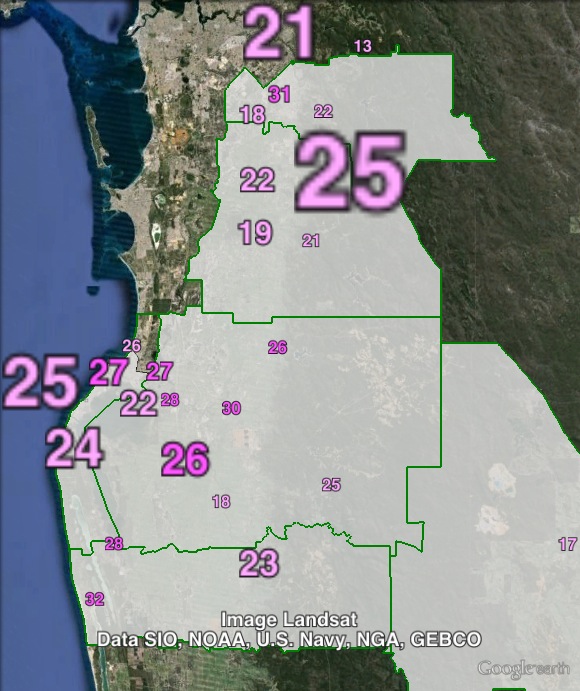
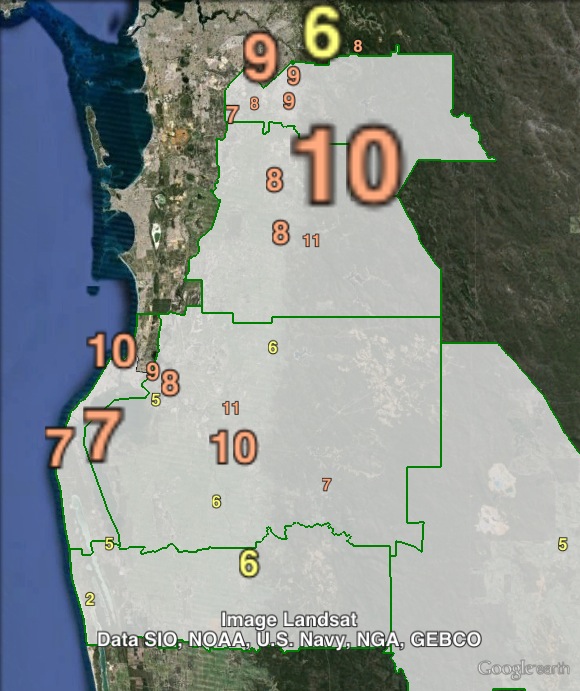
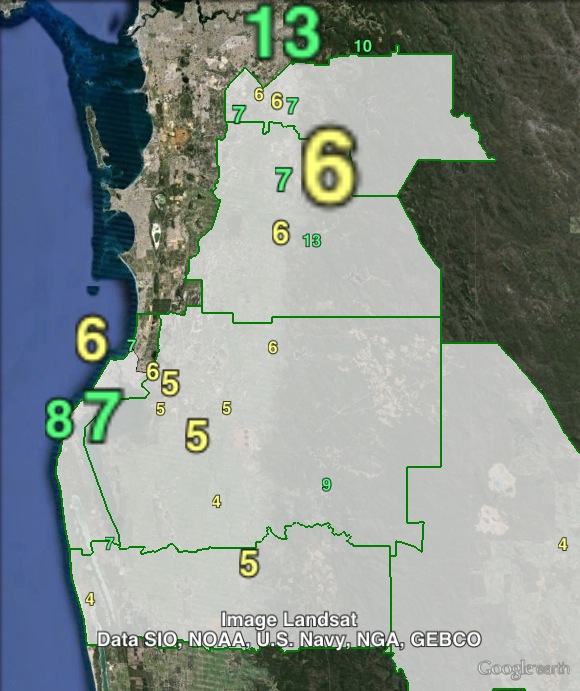
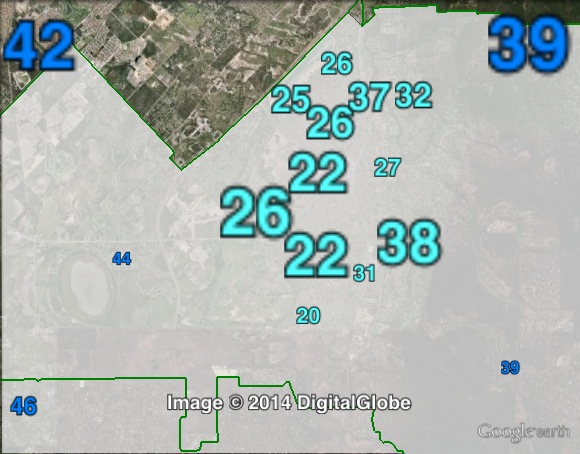
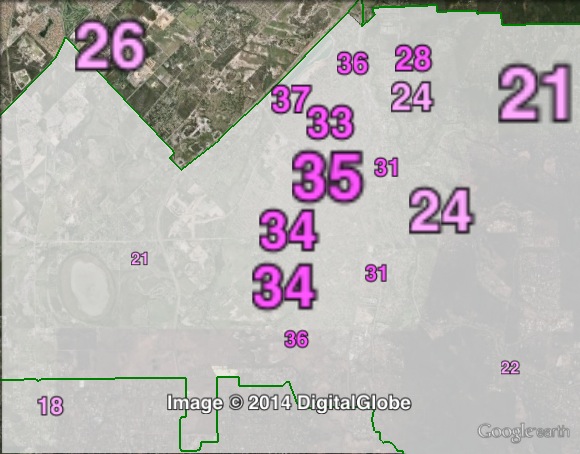
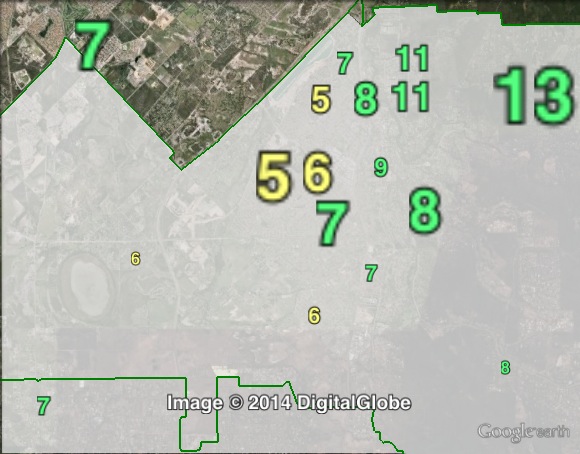
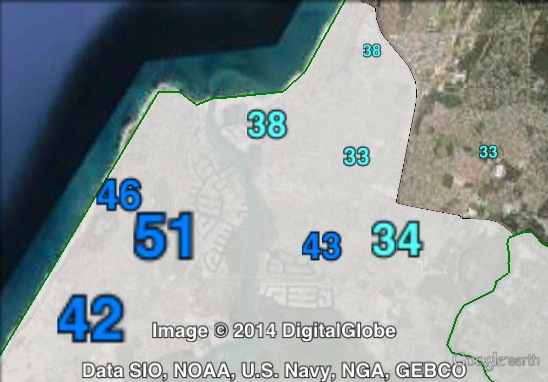
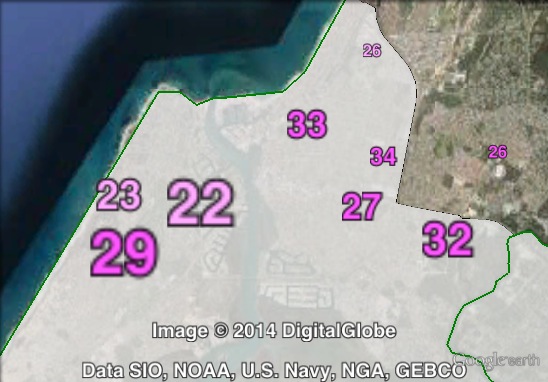
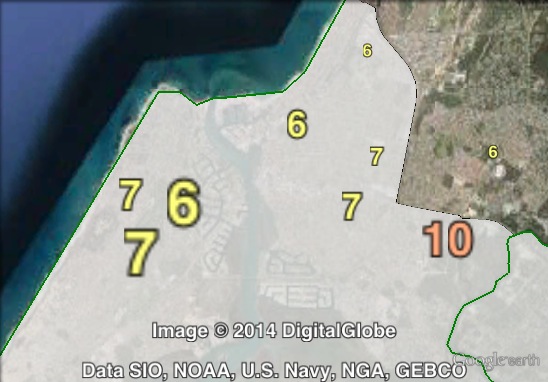
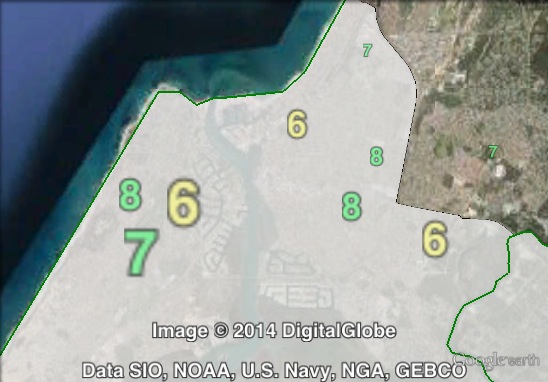
The Liberal Party topped the poll in all five areas, ranging from 31.5% in Armadale to 42.4% in Mandurah. The ALP’s vote ranged from 22.3% in the south to 29.2% in Armadale. The Palmer United Party came third, with a vote ranging from 5.7% in the south to 9% in Serpentine-Jarrahdale. The Greens came fourth, but overtook PUP in Mandurah, with over 7%. The Greens vote peaked at 8.1% in Armadale.
| Voter group | LIB % | ALP % | PUP % | GRN % | Total votes | % of votes |
| Armadale | 31.49 | 29.19 | 8.35 | 8.07 | 27,676 | 30.35 |
| Mandurah | 42.39 | 26.88 | 6.90 | 7.05 | 18,366 | 20.14 |
| Serpentine-Jarrahdale | 38.43 | 22.74 | 8.98 | 6.80 | 8,264 | 9.06 |
| Murray | 41.17 | 25.26 | 8.26 | 5.19 | 6,345 | 6.96 |
| South | 41.37 | 22.31 | 5.73 | 4.75 | 2,550 | 2.80 |
| Other votes | 40.75 | 27.65 | 5.33 | 6.04 | 27,995 | 30.70 |