LIB 12.0%
Incumbent MP
David Pisoni, since 2006.
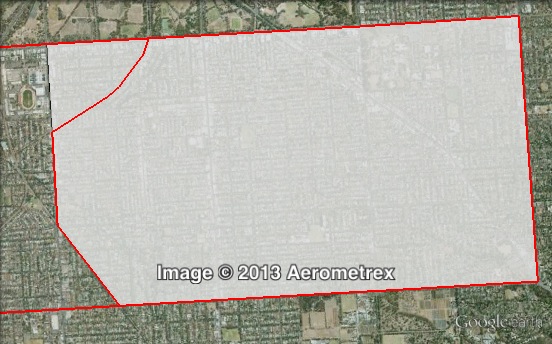
Geography
Inner-southern Adelaide. Unley covers suburbs immediately south of the Adelaide city centre, including Eastwood, Frewville, Fullarton, Glenunga, Highgate, Hyde Park, Kings Park, Malvern, Myrtle Bank, Parkside, Unley, Unley Park and parts of Glen Osmond, Goodwood, Millswood and Wayville. Most of the electorate lies within the City of Unley.
Redistribution
Unley remained largely intact, gaining parts of Wayville and Goodwood from Ashford. The Liberal Party’s margin was cut from 12.2% to 12%.
History
The electorate of Unley has existed since the 1938 election. The seat was held by the Liberal and Country League from 1941 to 1962, the ALP from 1962 to 1993, and the Liberal Party since 1993.
Mark Brindal won Unley in 1993. He had first won the electorate of Hayward in 1989, one term before it was abolished.
Unley shifted through the 1990s towards the Liberal Party, and Brindal held the seat by a solid margin. Brindal served as a minister during his second term from 1997 to 2002, and retired in 2006.
Unley was won in 2006 by the Liberal Party’s David Pisoni. Pisoni joined the Liberal frontbench in 2007, and was re-elected in 2010.
Candidates
Sitting Liberal MP David Pisoni is running for re-election. The ALP is running Lara Golding. The Greens are running Nikki Mortier. Dignity for Disability is running Joanne Blesing.
- Joanne Blesing (Dignity for Disability)
- Lara Golding (Labor)
- Nikki Mortier (Greens)
- David Pisoni (Liberal)
Assessment
Unley is a safe Liberal seat.
2010 result
| Candidate | Party | Votes | % | Swing |
| David Pisoni | LIB | 11,691 | 56.8 | +10.4 |
| Vanessa Vartto | ALP | 5,774 | 28.1 | -8.5 |
| Nikki Mortier | GRN | 2,711 | 13.2 | +3.6 |
| Luke Smolucha | FF | 396 | 1.9 | -0.7 |
2010 two-party-preferred result
| Candidate | Party | Votes | % | Swing |
| David Pisoni | LIB | 12,804 | 62.2 | +10.3 |
| Vanessa Vartto | ALP | 7,768 | 37.8 | -10.3 |
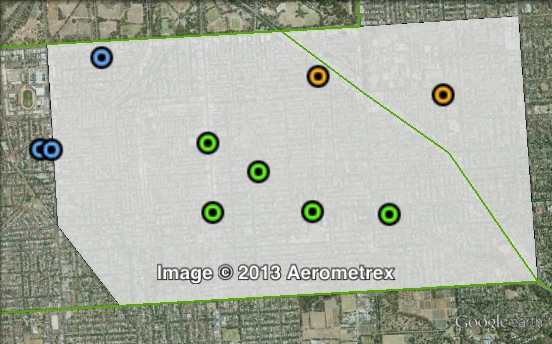
Booth breakdown
Booths have been divided into three parts: central, east and west. The central area makes up a majority of the seat’s population.
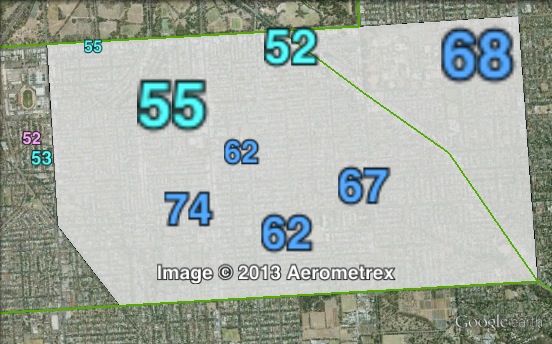
The Liberal Party won large majorities in the east (61.2%) and the centre (63.3%). The Liberal Party’s margin was much smaller in the west (52%).
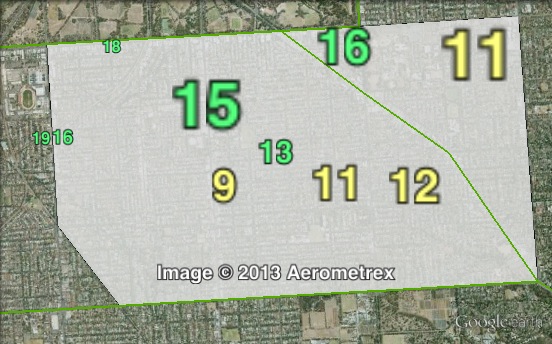
The Greens came third, with 17.6% in the west and between 12% and 13% in the centre and east.
| Voter group | GRN % | LIB 2PP % | Total votes | % of ordinary votes |
| Central | 12.31 | 63.32 | 9,491 | 58.45 |
| East | 12.91 | 61.21 | 4,764 | 29.34 |
| West | 17.59 | 51.97 | 1,984 | 12.22 |
| Other votes | 13.98 | 64.28 | 4,966 |
My prediction: Liberal retain