LIB 10.6%
Incumbent MP
Duncan McFetridge, since 2002.
Geography
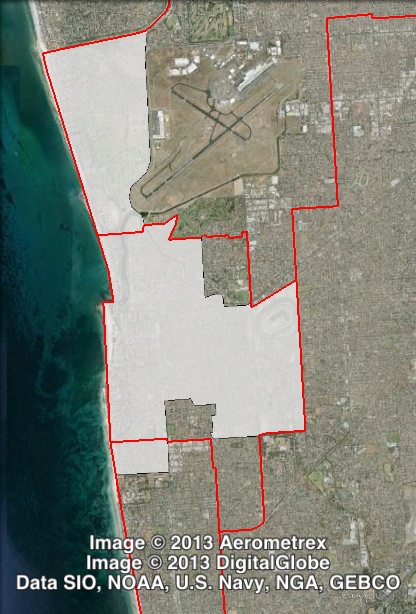
Western Adelaide. Morphett hugs the Adelaide coastline from West Beach to Somerton Park, and includes inland areas around Glengowrie. The seat also covers most of the Glenelg area.
Redistribution
Morphett underwent significant changes, losing Warradale to Elder, gaining West Beach from West Torrens, losing Novar Gardens to West Torrens and undergoing changes in the Somerton Park area. The redistribution reduced the Liberal margin from 11.1% to 10.6%.
History
The electorate of Morphett has existed since the 1977 election. The seat was won at that first election by the ALP, but has been Liberal-held since 1979.
Terrence Groom held the seat from 1977 to 1979, and was succeeded by the Liberal Party’s John Oswald.
Oswald held the seat for over twenty years. He served as a minister in the mid-1990s, and then as Speaker of the House of Assembly from 1997 to 2002, when he retired.
Duncan McFetridge has held Morphett since the 2002 election. He currently serves on the Liberal Party frontbench.
Candidates
Sitting Liberal MP Duncan McFetridge is running for re-election. The ALP are running Tim Looker. The Greens are running Matthew Carey. Family First are running Bob Randall.
- Duncan McFetridge (Liberal)
- Tim Looker (Labor)
- Bob Randall (Family First)
- Matthew Carey (Greens)
Assessment
Morphett is a safe Liberal seat.
2010 result
| Candidate | Party | Votes | % | Swing |
| Duncan McFetridge | LIB | 11,660 | 55.4 | +8.1 |
| Tim Looker | ALP | 6,595 | 31.3 | -6.6 |
| Jack Robins | GRN | 1,993 | 9.5 | +2.1 |
| Helen Zafiriou | FF | 807 | 3.8 | -0.5 |
2010 two-party-preferred result
| Candidate | Party | Votes | % | Swing |
| Duncan McFetridge | LIB | 12,856 | 61.1 | +7.6 |
| Tim Looker | ALP | 8,199 | 38.9 | -7.6 |
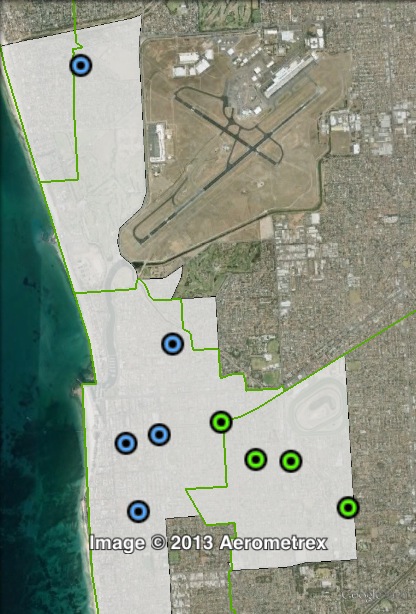
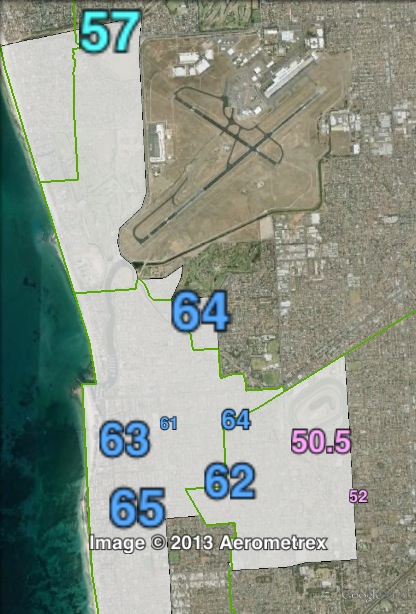
Booth breakdown
Booths have been divided into two halves. Those along the coast, most of which lie in the Glenelg area, as well as the one booth in West Beach, have been grouped as ‘Glenelg-North’. Those away from the coast have been grouped as East.
The Liberal Party won a majority in both areas: 61.9% in Glenelg-North, and 57.7% in the East of the seat.
The Greens came third, with 9.2% in the west of the seat and 8.6% in the east.
| Voter group | GRN % | LIB 2PP % | Total votes | % of ordinary votes |
| Glenelg-North | 9.20 | 61.85 | 9,009 | 65.11 |
| East | 8.60 | 57.74 | 4,827 | 34.89 |
| Other votes | 10.47 | 61.15 | 5,254 |
My prediction: Liberal retain