LIB 20.1%
Incumbent MP
Vickie Chapman, since 2002.
Geography
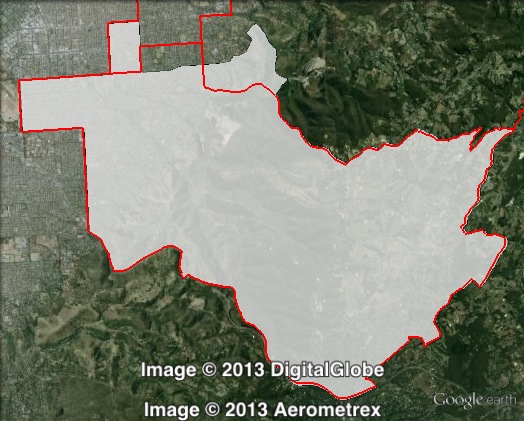
Eastern Adelaide. Bragg covers suburbs of Adelaide, stretching from those immediately to the south-east of the Adelaide city centre, out to southern parts of the Adelaide Hills. Most of the electorate’s population lies in the City of Burnside, with a minority in the Adelaide Hills and a small area in Norwood Payneham and St Peters.
Redistribution
Territory was swapped with Hartley to the north, and Bragg gained a small area from Morialta. This reduced the Liberal Party’s margin from 21.3% to 20.1%.
History
The electorate of Bragg has existed since 1970, and has always been held by the Liberal Party.
The seat was first won in 1970 by David Tonkin. He was elected Liberal leader in 1975, and after losing the 1977 election, he led the Liberal Party into government in 1979. He served as Premier for one term, losing in 1982. He resigned from Parliament in 1983.
Graham Ingerson was elected to Bragg at the 1983 Bragg by-election. He served in the ministry from 1993, and as Deputy Premier from 1996, until he resigned from both roles in 1998. Ingerson retired at the 2002 election.
Vickie Chapman was elected in Bragg at the 2002 election. She served as Liberal Party deputy leader from 2006 to 2009, and again since February 2013.
Candidates
Sitting Liberal MP Vickie Chapman is running for re-election. The Greens are running Ami Harrison.
- Ami Harrison (Greens)
- Ella Waters (Labor)
- Vickie Chapman (Liberal)
Assessment
Bragg is a very safe Liberal seat.
2010 result
| Candidate | Party | Votes | % | Swing |
| Vickie Chapman | LIB | 13,726 | 64.0 | +9.1 |
| Ben Dineen | ALP | 4,426 | 20.6 | -6.0 |
| Brendan Fitzgerald | GRN | 2,679 | 12.5 | +2.4 |
| Nick Zollo | FF | 614 | 2.9 | -1.0 |
2010 two-party-preferred result
| Candidate | Party | Votes | % | Swing |
| Vickie Chapman | LIB | 15,257 | 71.3 | +9.3 |
| Ben Dineen | ALP | 6,188 | 28.7 | -9.3 |
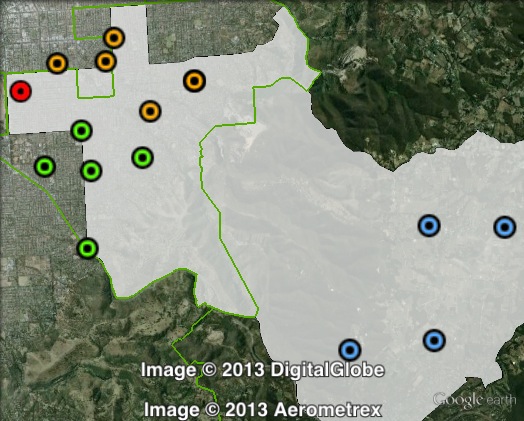
Booth breakdown
Booths have been divided into three parts: east, north and west. The ‘east’ lies entirely within the Adelaide Hills, while most of the north and west are in the City of Burnside.
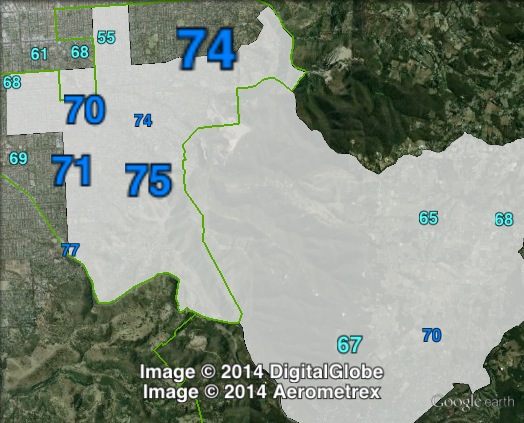
The Liberal Party won large majorities in all three parts of the seat, ranging from 67.1% in the east to 72.5% in the west.
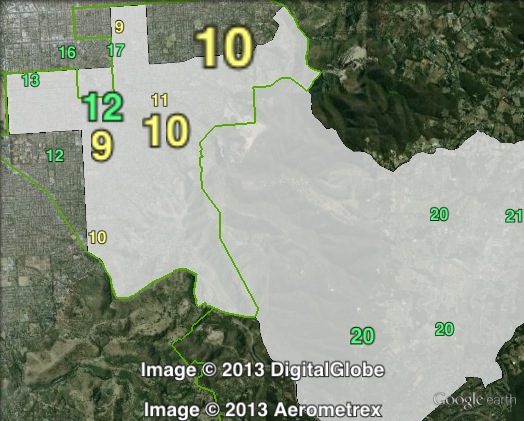
The Greens polled over 20% in the east of the electorate, outpolling the ALP. The Greens polled between 10% and 12% in the north and west.
| Voter group | GRN % | LIB 2PP % | Total votes | % of ordinary votes |
| North | 11.40 | 69.18 | 10,033 | 54.74 |
| West | 10.39 | 72.49 | 5,988 | 32.67 |
| East | 20.07 | 67.06 | 2,307 | 12.59 |
| Other votes | 12.56 | 71.79 | 4,435 |
My prediction: Liberal retain