LAB 22.58% vs NAT
Incumbent MP
David Cunliffe, since 2002. Previously Member for Titirangi 1999-2002.
Geography
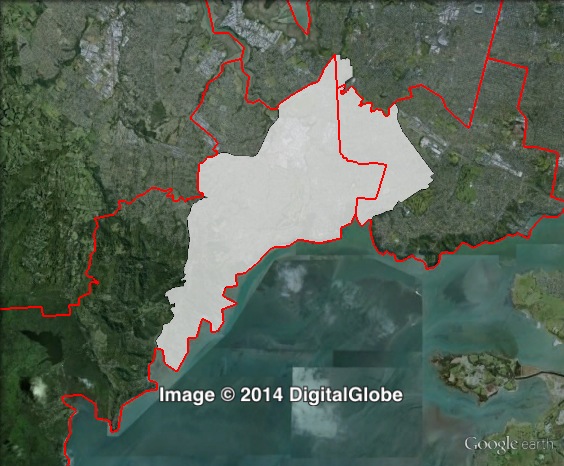
South-western suburbs of Auckland, including Avondale, Blockhouse Bay, Green Bay, Lynfield, Mt Roskill, New Lynn and Titirangi.
Redistribution
New Lynn shifted further into central Auckland. The electorate previously stretched much further along the north shore of Manukau Harbour all the way to the Tasman Sea. Those coastal areas were transferred to Helensville, while the suburb of Kelston became part of a new seat by the same name. In exchange, New Lynn gained New Windsor and parts of Lynfield and Mt Roskill from Mount Roskill electorate. These changes increased Labour’s margin from 15.9% to 22.6%.
History
New Lynn was first created as an electorate in 1963. The seat was abolished for one term from 1999-2002, before being restored. Since 1963, New Lynn has always been held by Labour MPs.
Jonathan Hunt held New Lynn from 1966 until 1996. In 1996, Phil Goff’s electorate of Roskill was abolished, and he shifted to New Lynn, and Hunt shifted to the Labour list. Hunt was re-elected on the party list twice more, and retired in 2005.
Phil Goff held New Lynn for one term before the seat was abolished in 1999, and the area was covered by the new electorates of Titirangi and Mount Roskill. Goff won Mount Roskill, and holds it up to this day.
Titirangi was won in 1999 by David Cunliffe.
In 2002, Titirangi was abolished and New Lynn was restored, and it was won by Cunliffe.
David Cunliffe was re-elected in New Lynn in 2005, 2008 and 2011. He served as a minister in the Labour-led government from 2002 to 2008.
National candidate Tim Groser was elected on the party list in 2008, and re-elected in 2011.
David Cunliffe was elected as leader of the Labour Party in 2013.
Candidates
- David Cunliffe (Labour #1), Member for New Lynn.
- Tim Groser (National #14), list MP.
- Andrew Leitch (Democrats #8)
- Daniel Rogers (Green #32)
- Steve Taylor (Conservative)
Assessment
New Lynn is a safe Labour seat.
2011 election results
| Electorate Votes | Party Votes | ||||||||
| Candidate | Party | Votes | % | Swing | Redist | Votes | % | Swing | Redist |
| David Cunliffe | Labour | 16,999 | 52.14 | +1.80 | 56.00 | 12,462 | 37.00 | -3.27 | 41.86 |
| Tim Groser | National | 11,809 | 36.22 | -2.43 | 33.42 | 13,211 | 39.22 | -0.88 | 37.26 |
| Saffron Toms | Green | 2,364 | 7.25 | +0.86 | 5.60 | 4,094 | 12.15 | +4.52 | 9.43 |
| Ivan Bailey | Conservative | 820 | 2.52 | +2.52 | 2.45 | 871 | 2.59 | +2.59 | 2.72 |
| Sean Davidson | Legalise Cannabis | 343 | 1.05 | +1.05 | 0.90 | 149 | 0.44 | +0.10 | 0.42 |
| Barbara Steinijans | ACT | 265 | 0.81 | -2.12 | 0.97 | 334 | 0.99 | -2.72 | 1.06 |
| New Zealand First | 0.57 | 2,081 | 6.18 | +2.62 | 6.06 | ||||
| Mana | 151 | 0.45 | +0.45 | 0.36 | |||||
| Māori | 148 | 0.44 | -0.26 | 0.35 | |||||
| United Future | 0.07 | 129 | 0.38 | -0.46 | 0.35 | ||||
| Libertarianz | 29 | 0.09 | +0.05 | 0.06 | |||||
| Alliance | 16 | 0.05 | -0.02 | 0.04 | |||||
| Democrats | 10 | 0.03 | +0.01 | 0.03 | |||||
| Communist | 0.03 | ||||||||
Booth breakdown
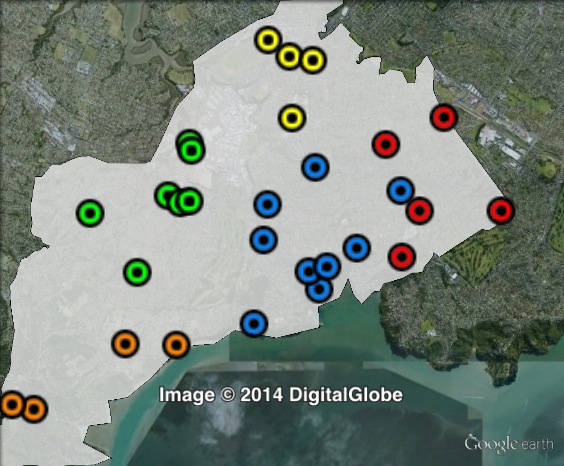
Booths in New Lynn have been divided into five parts, along the lines of the key suburbs in the electorate:
- Avondale
- Blockhouse Bay
- Green Bay-Titirangi
- Mt Roskill
- New Lynn
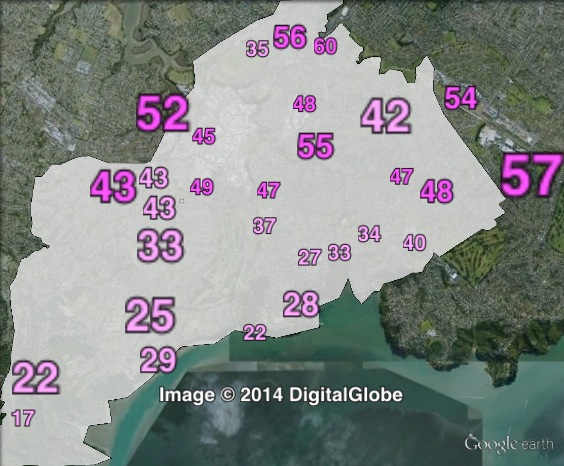
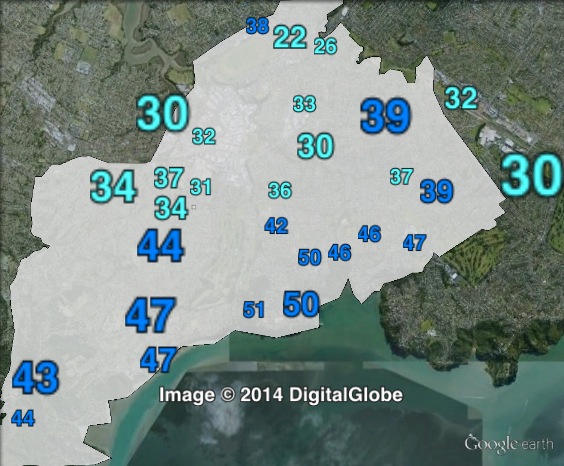
The Labour Party won a majority of the electorate vote in four out of five areas, ranging from 52.3% in Blockhouse Bay to 64% in Avondale. In Green Bay-Titirangi, the National Party won a narrow plurality, with Labour winning 43.2% and National winning 45.2%.
The Labour Party won a plurality in three out of five areas: New Lynn, Mt Roskill and Avondale. The National Party won a plurality in Blockhouse Bay and Green Bay-Titirangi.
The Green Party came third, with a party vote ranging from 5.2% in Mount Roskill to 18.6% in Green Bay-Titirangi.
| Voter group | Electorate votes | Party votes | Total | % of votes | |||||
| LAB | NAT | GRN | NAT | LAB | GRN | NZF | |||
| New Lynn | 58.87 | 35.31 | 5.54 | 43.39 | 35.31 | 8.91 | 6.78 | 7,039 | 20.90 |
| Mt Roskill | 61.64 | 35.82 | 3.10 | 49.54 | 35.82 | 5.19 | 4.53 | 6,009 | 17.84 |
| Blockhouse Bay | 52.28 | 42.03 | 4.54 | 38.69 | 42.03 | 6.79 | 6.66 | 5,819 | 17.27 |
| Green Bay-Titirangi | 43.16 | 45.19 | 9.97 | 23.77 | 45.19 | 18.57 | 6.69 | 4,585 | 13.61 |
| Avondale | 64.00 | 28.45 | 5.84 | 49.56 | 28.45 | 10.64 | 6.55 | 2,347 | 6.97 |
| Other votes | 56.97 | 34.81 | 5.76 | 44.92 | 34.81 | 9.42 | 5.64 | 7,888 | 23.42 |