NAT 45.97% vs LAB
Incumbent MP
John Key, since 2002.
Geography
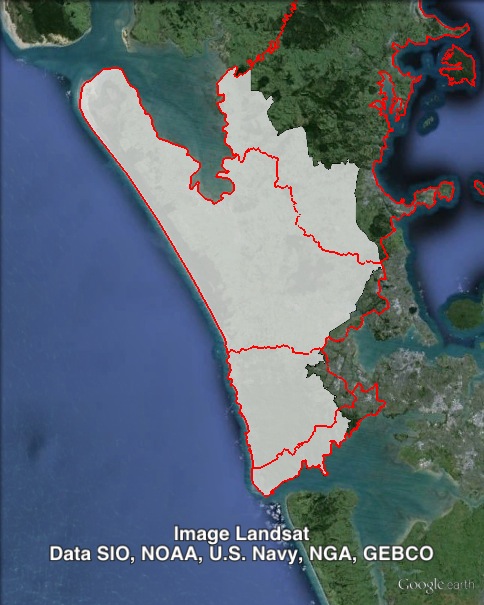
Northwestern outskirts of Auckland. Helensville covers predominantly rural areas in the Auckland Region to the north and west of the Auckland urban area, including Waitakere and Makarau.
Redistribution
Helensville changed significantly due to dramatic changes to boundaries in the western suburbs of Auckland, which saw two new seats created and one seat abolished. Helensville lost urban areas to Upper Harbour and gained rural areas from Waitakere, New Lynn and Rodney. These changes cut the National margin from 60.2% to 46%.
History
Helensville has existed in its current form since 2002, and before that from 1978 to 1984. The seat has always been held by the National Party.
Helensville was created in 2002 out of parts of Rodney and Waitakere. Both seats had been held by the National Party continuously since their creation in 1996 and 1993 respectively.
In 2002, Waitakere MP Brian Neeson ran for National preselection against John Key, and Key won. Neeson ran as an independent in Helensville, and came third. The split in the National vote brought Key as close as he has ever come to defeat, beating the Labour candidate by less than 6% with a vote of 34%.
The fourth-placed New Zealand First candidate, Dail Jones, was elected as a list MP. Jones had previously held Helensville as a National MP from 1978 to 1984. He lost his seat in 2005, and briefly served in Parliament again in 2008.
John Key rose up through the National Party ranks quickly, taking on the finance portfolio in 2004. In 2005, Key increased his majority to 37.2%.
Key was elected leader of the National Party in 2006, and led the National Party to power in 2008. He has served as Prime Minister since 2008, winning a second term in 2011.
Key increased his margin in Helensville to 56.5% in 2008, and further again to 60.2% in 2011.
At the 2008 election, Labour list MP Darien Fenton was elected to a second term after running in Helensville. She was re-elected in 2011 after running in a different seat. In addition, ACT candidate David Garrett was elected on the party list. Garrett resigned from Parliament in 2010.
Green candidate David Clendon missed out on winning a list seat in 2008, but filled a casual vacancy in 2009.
Candidates
- Penny Bright (Independent)
- Deborah Dougherty (Conservative)
- Kennedy Graham (Green #7), list MP.
- Corie Haddock (Labour #53)
- Laila Harré (Internet #2)
- John Key (National #1), Member for Helensville.
- Phelan Pirrie (ACT #12)
- Brendan Whyte (Independent)
Assessment
Helensville is a very safe National seat, particularly with the sitting Prime Minister as the local member.
2011 election results
| Electorate Votes | Party Votes | ||||||||
| Candidate | Party | Votes | % | Swing | Redist | Votes | % | Swing | Redist |
| John Key | National | 26,011 | 74.38 | +0.77 | 65.01 | 23,558 | 65.79 | +2.09 | 60.42 |
| Jeremy Greenbrook-Held | Labour | 4,945 | 14.14 | -2.97 | 19.05 | 5,138 | 14.35 | -4.11 | 14.23 |
| Jeanette Elley | Green | 2,575 | 7.36 | +1.41 | 9.17 | 3,094 | 8.64 | +3.74 | 13.44 |
| Richard Drayson | Conservative | 941 | 2.69 | +2.69 | 4.86 | 1,258 | 3.51 | +3.51 | 3.50 |
| Adrian McDermott | Legalise Cannabis | 319 | 0.91 | +0.91 | 0.96 | 174 | 0.49 | +0.13 | 0.55 |
| Nick Kearney | ACT | 180 | 0.51 | -1.72 | 0.35 | 499 | 1.39 | -5.31 | 1.30 |
| New Zealand First | 0.38 | 1,648 | 4.60 | +2.06 | 5.10 | ||||
| Māori | 186 | 0.52 | +0.03 | 0.54 | |||||
| United Future | 163 | 0.46 | -0.33 | 0.47 | |||||
| Mana | 0.18 | 60 | 0.17 | +0.17 | 0.28 | ||||
| Libertarianz | 0.03 | 19 | 0.05 | 0.00 | 0.09 | ||||
| Democrats | 8 | 0.02 | 0.00 | 0.03 | |||||
| Alliance | 4 | 0.01 | -0.04 | 0.03 | |||||
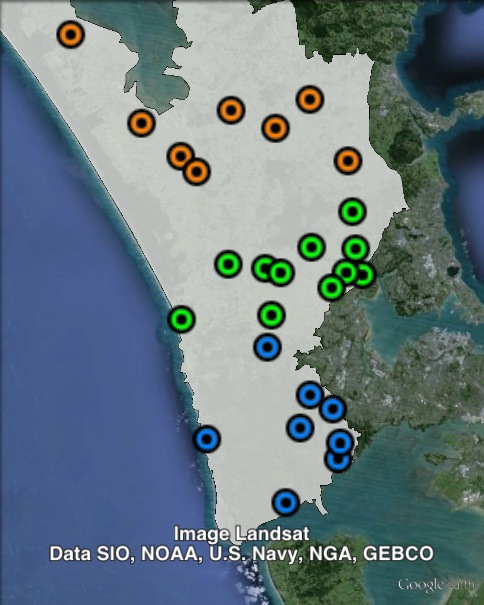
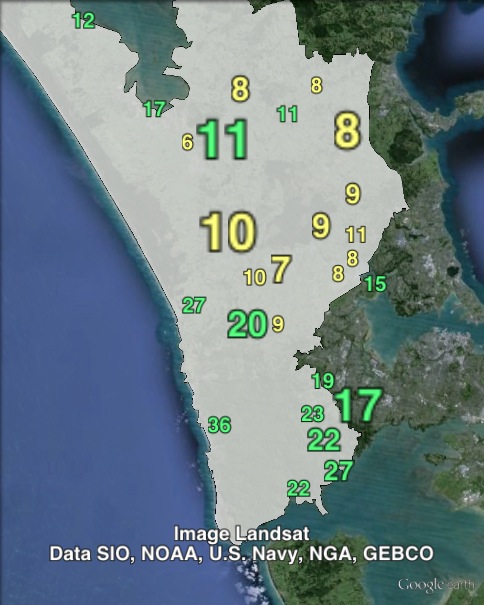
Booth breakdown
Booths in Helensville have been divided into three areas: Central, North or South. The “South” area contains all of the polling places previously contained in Waitakere or New Lynn.
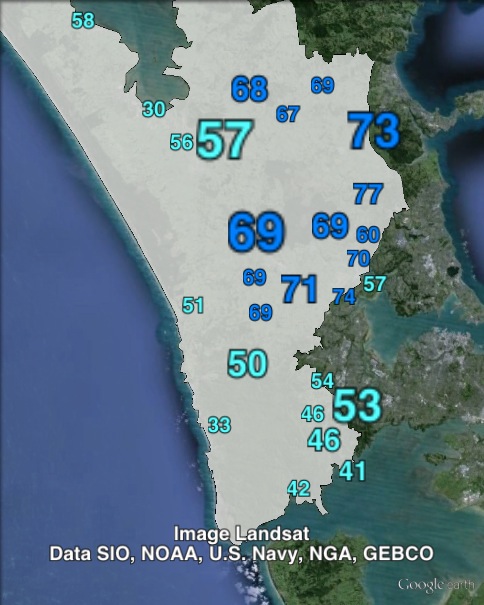
The National vote ranges widely. The National vote is highest in Central, with 68-77%, followed by 64-66% in North and 47-50% in South.
Labour’s vote is much higher in the south than in the other parts of the seat. Labour’s electorate vote was 35% in the south, compared to only 10% in the centre.
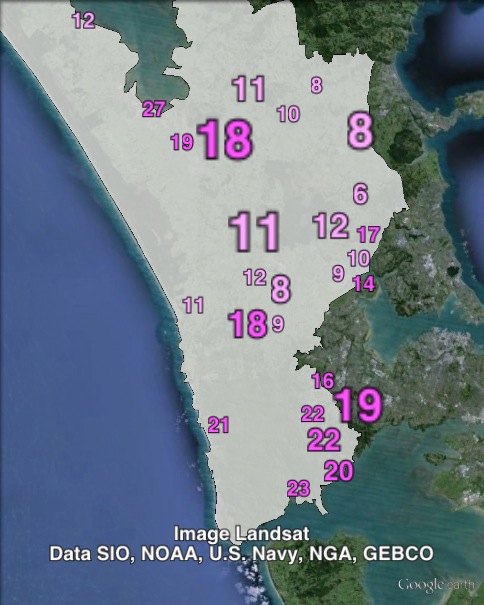
The Green Party vote is highest in the south, peaking at 21.7% of the party vote in the south. The Green Party outpolled Labour on the party vote in two out of three areas.
| Voter group | Electorate votes | Party votes | Total | % of votes | |||||
| NAT | LAB | GRN | NAT | LAB | GRN | NZF | |||
| Central | 77.29 | 10.20 | 8.42 | 68.31 | 10.32 | 10.42 | 4.51 | 8,585 | 30.81 |
| South | 49.63 | 35.30 | 11.02 | 47.55 | 19.52 | 21.74 | 5.80 | 6,406 | 22.99 |
| North | 65.66 | 14.39 | 7.80 | 64.47 | 12.71 | 8.84 | 5.48 | 6,150 | 22.07 |
| Other votes | 63.41 | 19.11 | 9.62 | 58.95 | 15.51 | 13.61 | 4.84 | 6,722 | 24.12 |
My prediction: PM Key will be easily returned.