| Electorate | Margin | Electorate | Margin |
| Clutha-Southland | NAT 52.06% vs LAB | Rangitata | NAT 17.09% vs LAB |
| Dunedin North | LAB 9.12% vs NAT | Selwyn | NAT 55.77% vs LAB |
| Dunedin South | LAB 12.12% vs NAT | Waimakariri | NAT 3.02% vs LAB |
| Invercargill | NAT 19.79% vs LAB | Waitaki | NAT 37.34% vs LAB |
| Kaikōura | NAT 34.54% vs LAB | West Coast-Tasman | LAB 7.66% vs NAT |
| Nelson | NAT 20.51% vs LAB |
 Local electorates
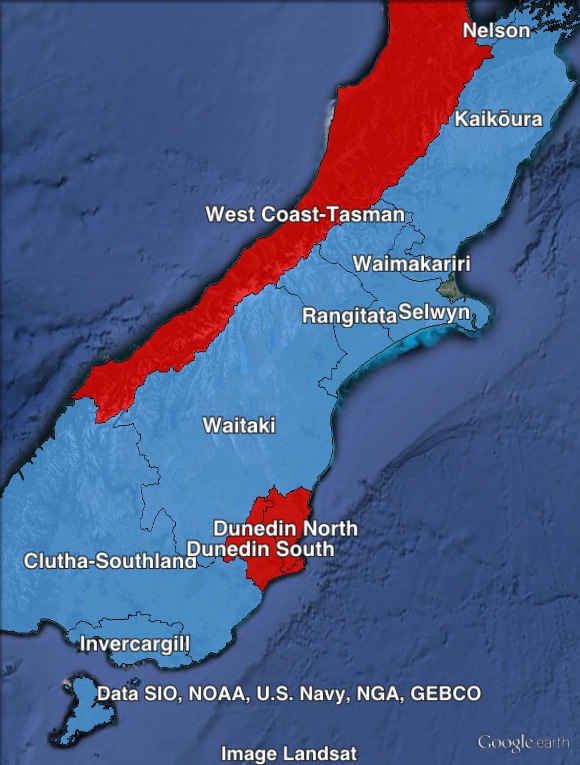
There are sixteen electorates on the South Island. This post covers the eleven seats that are outside of the Christchurch urban area.
Three of these seats are held by Labour, and eight are held by National.
The Labour Party holds both Dunedin seats: Dunedin North and Dunedin South. These two seats are both reasonably marginal but are unlikely to change hands. Labour also holds West Coast-Tasman, which stretches along most of the west coast of the South Island. That seat is also reasonably marginal, with a 7.7% margin.
National holds two safe seats north of Christchurch: Kaikōura and Nelson. The National seat of Waimakariri, immediately north of Christchurch, is on a slim 3% margin.
The seats of Rangitata, Selwyn and Waitaki, which all lie between Christchurch and Dunedin, are also safe National seats.
South of Dunedin, National holds two more safe seats: Clutha-Southland and Invercargill.
Redistribution
Changes to most seats were relatively minor. No changes were made to Clutha-Southland, Dunedin South, Invercargill, Kaikōura, Nelson and West Coast-Tasman.
Assessment
This region is relatively strong for the National Party (3-5% above national vote), and relatively weak for Labour (1-2% below national vote).
The Green Party performed strongly on the South Island – outpolling their national electorate vote by 2% and the national party vote by 1.2%. The Green Party did even better in Christchurch, producing a very strong overall result across the island.
New Zealand First polled slightly less in the South Island than their overall result.
2011 election results
| Electorate Votes | Party Votes | |||||||
| Party | Votes | % | Swing | Redist | Votes | % | Swing | Redist |
| National | 196,890 | 52.95 | +0.82 | 52.78 | 194,583 | 51.22 | +4.43 | 50.96 |
| Labour | 125,356 | 33.71 | -3.42 | 33.78 | 94,840 | 24.96 | -9.16 | 25.04 |
| Green | 33,634 | 9.05 | +3.74 | 9.15 | 46,261 | 12.18 | +4.57 | 12.29 |
| New Zealand First | 3,513 | 0.94 | +0.41 | 0.90 | 22,052 | 5.80 | +2.15 | 5.84 |
| Conservative | 4,233 | 1.14 | +1.14 | 1.11 | 9,931 | 2.61 | +2.61 | 2.61 |
| ACT New Zealand | 3,062 | 0.82 | -0.78 | 0.85 | 3,654 | 0.96 | -1.98 | 0.97 |
| United Future | 1,252 | 0.34 | -0.14 | 0.35 | 3,102 | 0.82 | -0.10 | 0.82 |
| Legalise Cannabis | 848 | 0.23 | -0.05 | 0.24 | 2,115 | 0.56 | +0.14 | 0.57 |
| Māori | 1,473 | 0.39 | -0.10 | 0.39 | ||||
| Mana | 727 | 0.19 | +0.19 | 0.19 | ||||
| Democrats | 1,538 | 0.41 | +0.28 | 0.43 | 633 | 0.17 | +0.07 | 0.17 |
| Alliance | 352 | 0.09 | -0.13 | 0.10 | 296 | 0.08 | -0.06 | 0.08 |
| Libertarianz | 264 | 0.07 | +0.04 | 0.07 | 235 | 0.06 | +0.03 | 0.06 |
| Others | 880 | 0.24 | -1.90 | 0.25 | ||||
