NAT 1.33% vs LAB
Incumbent MP
Nicky Wagner, since 2011. Previously list MP 2005-2011.
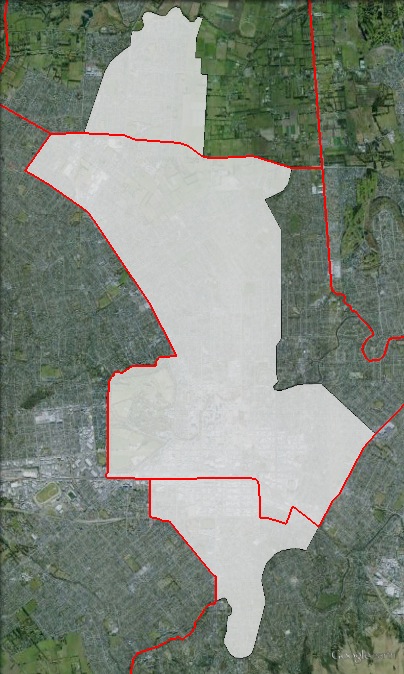
Geography
Central suburbs of Christchurch City, including Sydenham, Redwood, Papanui, St Albans, Mairehau, Linwood and the Christchurch city centre. The electorate is narrow along a north-south axis, from Redwood in the north to Beckenham in the south.
Redistribution
Christchurch Central lost suburbs along its eastern boundary, including Richmond and Avonside, to Christchurch East, and gained Redwood on its northern boundary from Waimakariri, and Beckenham and Sydenham on its southern boundary from Port Hills. These changes increased the National margin from 0.17% to 1.33%.
History
An electorate by the name of Christchurch Central has existed since the 1946 election. Until the most recent election, the seat had always been won by Labour.
Robert Macfarlane won Christchurch Central at the first election in 1946. He had previously held the seat of Christchurch South from 1939 to 1946, when the seat was effectively abolished into Christchurch Central.
Macfarlane held the seat for over twenty years, until his retirement in 1969. He served as Speaker of the House of Representatives from 1958 to 1960.
Bruce Barclay held Christchurch Central from 1969 until his death in 1979.
The 1979 by-election was won by Labour’s Geoffrey Palmer. Palmer became deputy leader of the Labour Party in 1983, and Deputy Prime Minister after the Labour Party won power in 1984.
Palmer served in a variety of ministries, and in August 1989 replaced David Lange as Labour leader and Prime Minister. Palmer’s prime ministership was short and unsuccessful, and he resigned in late 1990, shortly before the 1990 general election. Mike Moore led the Labour government to defeat, and Palmer retired from Christchurch Central at the election.
Lianne Dalziel won Christchurch Central at the 1990 election. Dalziel was re-elected in Christchurch Central twice, representing the seat until the 1996 election.
The New Zealand electoral map was redrawn in 1996, with the number of electorates reduced from 99 to 65. Dalziel switched to run on the Labour party list, and was elected as a list MP. She went on to win Christchurch East in 1999, and held it until her resignation in 2013 when she successfully ran for Mayor of Christchurch.
Christchurch Central was won in 1996 by Tim Barnett. Barnett held the seat until he retired at the 2008 election.
Christchurch Central was won in 2008 by Labour’s Brendon Burns, but with a much-reduced margin. National List MP Nicky Wagner cut the Labour margin from 23.29% to 2.91%.
In 2011, Wagner defeated Burns by a very slim 47-vote margin in 2011, after the vote was tied on election night. Burns was too far down the Labour list to return to Parliament, while Wagner would have been returned to Parliament if he had missed out on winning in Christchurch Central.
Candidates
- George Abraham (New Zealand First #18)
- Robin Columbus (Democrats #12)
- Michael Cooke (Conservative)
- Lenis Davidson (Māori #20)
- Tony Milne (Labour #36)
- David Moorhouse (Green #22)
- Toni Severin (ACT #11)
- Nicky Wagner (National #25), Member for Christchurch Central.
Assessment
Christchurch Central was one of the closest electorate contests in New Zealand at the 2011 election, and it’s likely to be very close again in 2014. Despite the closeness of the race, the winner of Christchurch Central will not have an impact on the distribution of seats overall in the Parliament, although it will matter to the candidates in this electorate.
Christchurch Central has a very high Green party vote – 15.8% of the vote on the new boundaries. The seat will be critical to the Green Party’s aim of increasing its party vote.
2011 election results
| Electorate Votes | Party Votes | ||||||||
| Candidate | Party | Votes | % | Swing | Redist | Votes | % | Swing | Redist |
| Nicky Wagner | National | 12,064 | 44.53 | +3.61 | 45.15 | 12,506 | 44.63 | +7.05 | 46.78 |
| Brendon Burns | Labour | 12,017 | 44.36 | +0.52 | 43.83 | 8,240 | 29.40 | -9.96 | 27.86 |
| David Moorhouse | Green | 2,321 | 8.57 | +0.14 | 8.31 | 4,556 | 16.26 | +5.09 | 15.81 |
| Michael Cooke | Conservative | 439 | 1.62 | +1.62 | 1.30 | 487 | 1.74 | +1.74 | 1.89 |
| Luke Chandler | Independent | 138 | 0.51 | +0.51 | 0.35 | ||||
| Toni Severin | ACT | 110 | 0.41 | -1.09 | 0.39 | 219 | 0.78 | -1.93 | 0.78 |
| New Zealand First | 0.68 | 1,391 | 4.96 | +1.83 | 4.78 | ||||
| Legalise Cannabis | 180 | 0.64 | +0.08 | 0.63 | |||||
| United Future | 151 | 0.54 | -0.18 | 0.55 | |||||
| Māori | 139 | 0.50 | -0.20 | 0.44 | |||||
| Mana | 100 | 0.36 | +0.36 | 0.31 | |||||
| Alliance | 24 | 0.09 | -0.04 | 0.05 | |||||
| Libertarianz | 22 | 0.08 | +0.01 | 0.08 | |||||
| Democrats | 9 | 0.03 | -0.02 | 0.03 | |||||
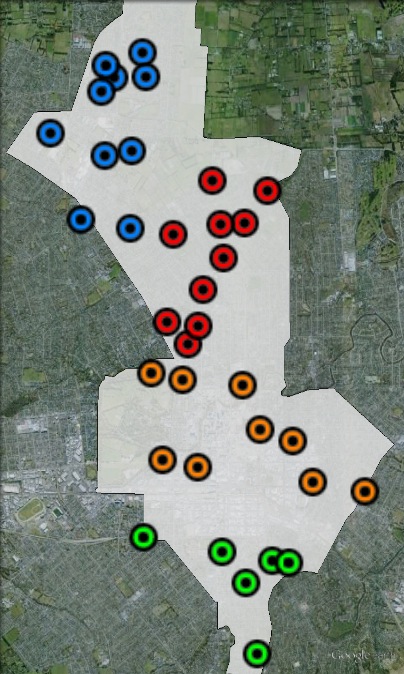
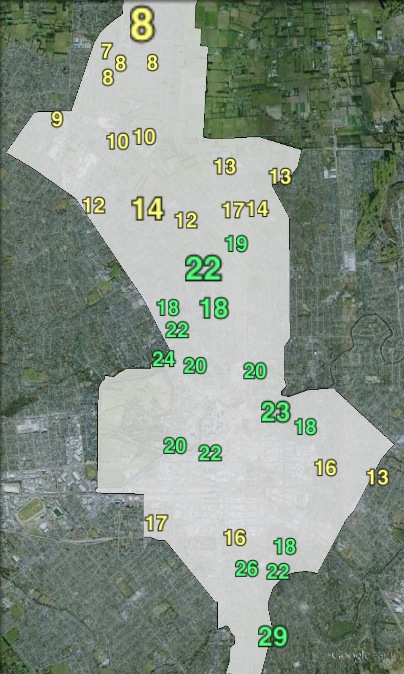
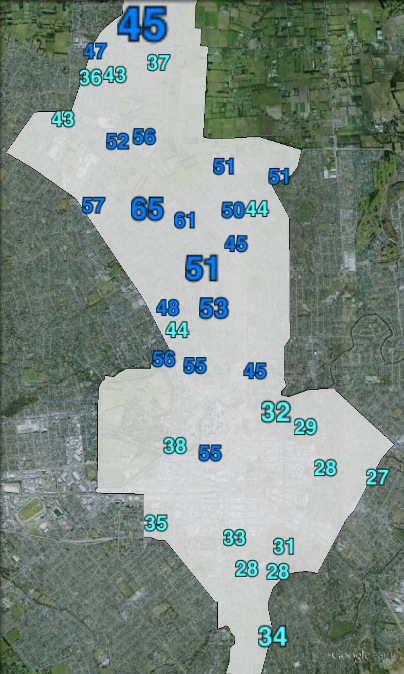
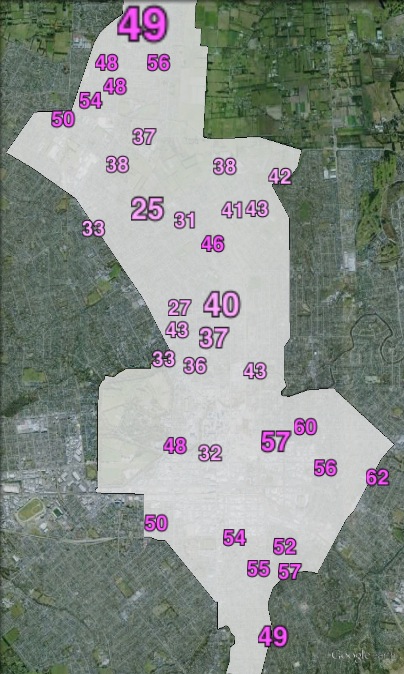
Booth breakdown
Booths in Christchurch Central have been broken into four areas. From north to south, these are:
- Papanui-Redwood
- St Albans-Mairehau
- City, including the Christchurch city centre, Linwood and Phillipstown
- South, including Addington, Beckenham, Opawa, Sydenham and Waltham
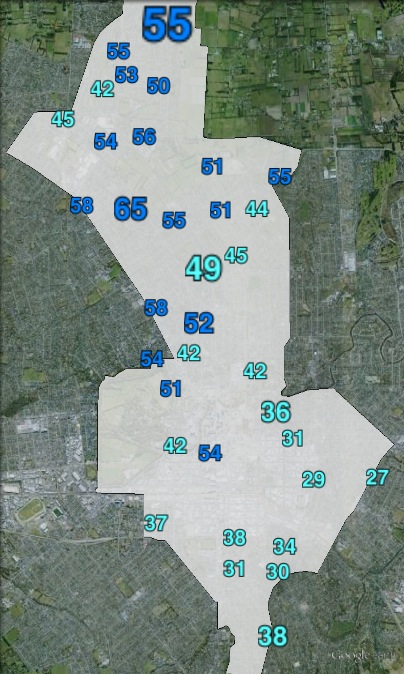
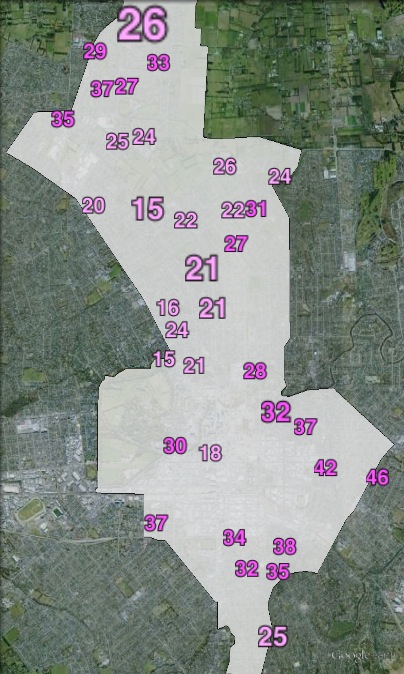
The National Party outpolled the Labour Party in the electorate vote in two out of four areas, with Labour outpolling the Nationals in the other two. Labour polled a majority of the electorate vote in the city and in the south, while National polled a slim majority in St Albans-Mairehau and a plurality in Papanui-Redwood. The Green electorate vote ranges from 4.9% in Papanui-Redwood to 12.8% in the south.
In the party vote, the Nationals topped the poll in all four areas, although Labour and the Greens combined to win a majority of votes in the city and south. The National vote ranged from 54.6% in Papanui-Redwood to 35.3% in the south.
The Labour party vote ranged from 23.5% in St Albans-Mairehau to 32.5% in the city, while the Green vote ranged from 9.5% in Papanui-Redwood to 22.9% in the south.
New Zealand First came fourth in the party vote, with a vote ranging from 4.4% in St Albans-Mairehau to 5.4% in the city.
| Voter group | Electorate votes | Party votes | Total | % of votes | |||||
| NAT | LAB | GRN | NAT | LAB | GRN | NZF | |||
| Papanui-Redwood | 48.47 | 43.60 | 4.89 | 54.56 | 26.06 | 9.52 | 5.00 | 6,214 | 21.44 |
| St Albans-Mairehau | 50.40 | 39.40 | 7.74 | 49.65 | 23.53 | 17.39 | 4.44 | 5,802 | 20.02 |
| City | 36.86 | 50.84 | 9.66 | 37.66 | 32.48 | 19.50 | 5.37 | 3,570 | 12.32 |
| South | 31.87 | 52.10 | 12.83 | 35.25 | 32.04 | 22.87 | 5.19 | 2,783 | 9.60 |
| Other votes | 46.62 | 41.86 | 8.97 | 46.79 | 28.57 | 15.55 | 4.53 | 10,614 | 36.62 |
My prediction: Should be National-held in a close contest.