NAT 14.02% vs LAB
Incumbent MP
Nathan Guy, since 2008. Previously list MP 2005-2008.
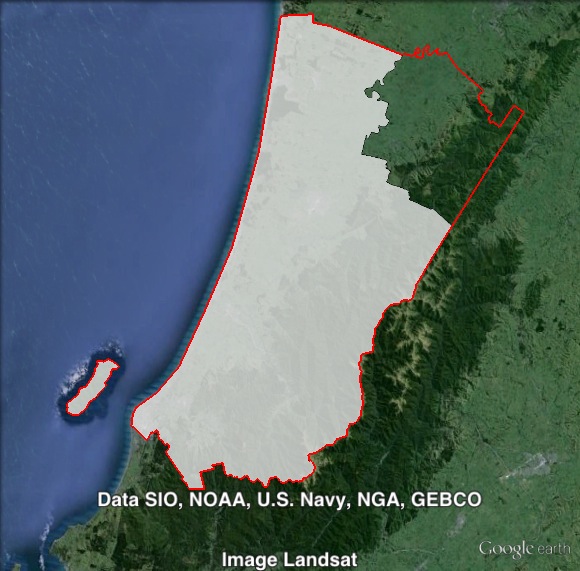
Geography
Regional areas to the north of Wellington. Ōtaki covers most of Horowhenua and Kapiti Coast council areas, including the towns of Otaki, Levin, Foxton and Paraparaumu.
Redistribution
Ōtaki’s eastern, western and southern boundaries remained the same in the redistribution, and Ōtaki lost its northwestern corner to Rangitīkei. The boundaries previously aligned with the northwestern boundaries of Horowhenua council area. The National margin was cut very slightly from 14.1% to 14%.
History
The electorate of Ōtaki has existed since the 1996 election. Before that, Otaki had existed from 1893 to 1972. The seat has been held by both major parties throughout the last century.
Labour’s Judy Keall won Otaki in 1996. Keall had previously represented the Auckland electorate of Glenfield from 1984 to 1990, when she lost her seat. She won the seat of Horowhenua in 1993. That seat was abolished in 1996, and was largely replaced by Otaki.
Keall was re-elected in 1999, and retired in 2002.
Keall defeated National MP Roger Sowry, who had held the seat of Kapiti since 1990. Kapiti was also abolished and largely absorbed by Otaki. Sowry ran in Otaki and won a seat on the party list in 1996, 1999 and 2002.
In 2002, Labour’s Darren Hughes won Ōtaki against Sowry. In 2005, Hughes was re-elected, and National candidate Nathan Guy won a seat on the party list. Hughes survived with a margin of only 1% ahead of Guy.
In 2008, Guy defeated Hughes by 3.5%, and Hughes retained his seat as a list MP. Hughes resigned from Parliament in early 2011.
Guy increased his margin from 3.5% to 14.1% in 2011.
Candidates
- Maddy Drew (Green #42)
- Nathan Guy (National #16), Member for Ōtaki.
- Anne Lovelock (Conservative)
- Frederick MacDonald (Independent)
- Rob McCann (Labour)
- Amanda Vickers (Independent)
Assessment
Ōtaki was Labour-held until the defeat of the last Labour government in 2008, so despite a large 14% margin, it’s the kind of seat that could be vulnerable if Labour is on track to win power nationally. Short of a strong national swing to Labour, however, Ōtaki is likely to stay with National.
2011 election results
| Electorate Votes | Party Votes | ||||||||
| Candidate | Party | Votes | % | Swing | Redist | Votes | % | Swing | Redist |
| Nathan Guy | National | 19,151 | 51.57 | +51.57 | 51.58 | 17,609 | 46.79 | +2.02 | 46.93 |
| Peter Foster | Labour | 13,920 | 37.48 | +37.48 | 37.56 | 11,137 | 29.59 | -7.36 | 29.49 |
| Michael Gilchrist | Green | 1,750 | 4.71 | +4.71 | 4.70 | 3,612 | 9.60 | +3.96 | 9.68 |
| David Scott | New Zealand First | 1,122 | 3.02 | +3.02 | 3.01 | 3,057 | 8.12 | +2.63 | 8.09 |
| John Ryersson | Conservative | 644 | 1.73 | +1.73 | 1.72 | 1,202 | 3.19 | +3.19 | 3.17 |
| Fred MacDonald | Legalise Cannabis | 253 | 0.68 | +0.68 | 0.67 | 162 | 0.43 | +0.14 | 0.43 |
| Peter McCaffrey | ACT | 115 | 0.31 | +0.31 | 0.30 | 253 | 0.67 | -1.92 | 0.65 |
| Diane Brown | United Future | 110 | 0.30 | +0.30 | 0.28 | 266 | 0.71 | -0.31 | 0.70 |
| Philip Dean Taueki | Independent | 73 | 0.20 | +0.20 | 0.18 | ||||
| Māori | 210 | 0.56 | -0.26 | 0.54 | |||||
| Mana | 80 | 0.21 | +0.21 | 0.20 | |||||
| Libertarianz | 19 | 0.05 | +0.02 | 0.05 | |||||
| Democrats | 15 | 0.04 | +0.01 | 0.04 | |||||
| Alliance | 11 | 0.03 | -0.04 | 0.03 | |||||
Booth breakdown
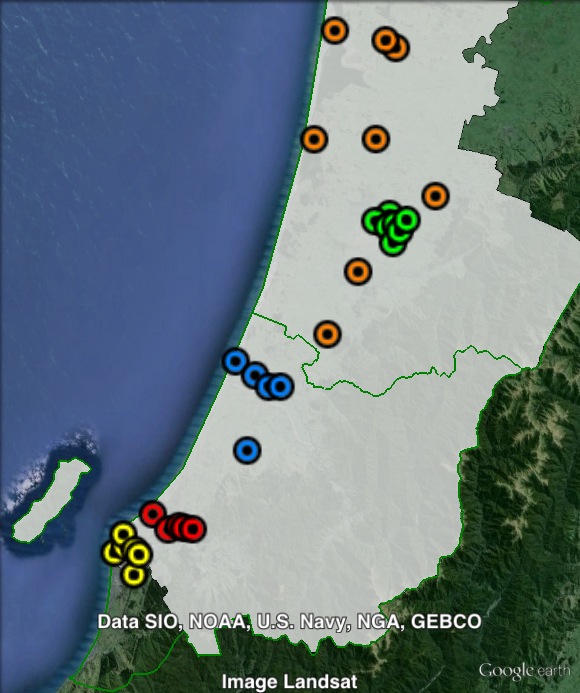
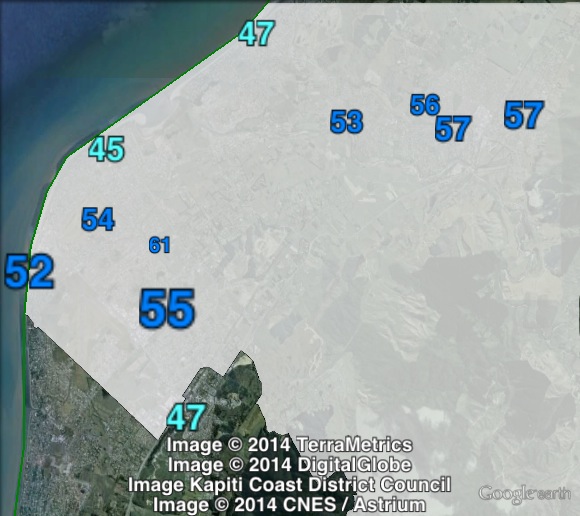
Booths in Ōtaki have been divided into five areas. Polling places in Horowhenua council area have been split between those in the town of Levin, and the remainder of the area grouped as ‘north’.
Those in Kapiti Coast council area have been split into three groups: from north to south, these are Otaki, Waikanae, and Paraparaumu.
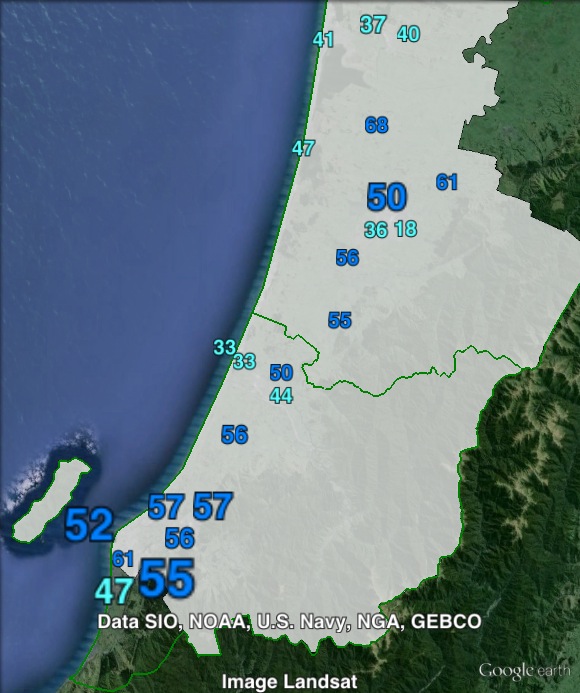
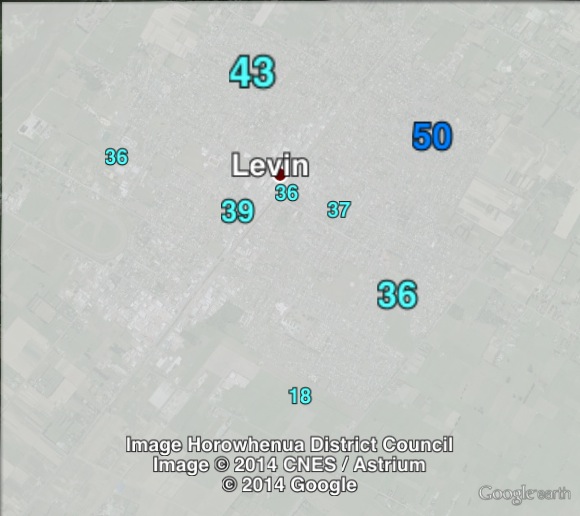
The National Party topped the electorate vote in all five areas, with a majority in three. The National vote was 55% in Paraparaumu, Waikanae and North, and as between 47% and 48% in Levin and Otaki.
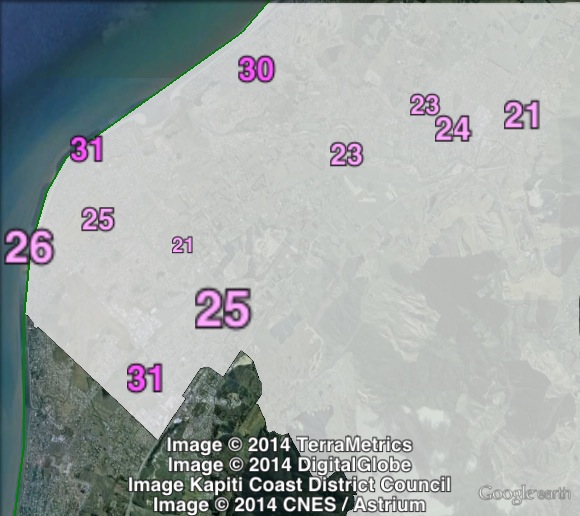
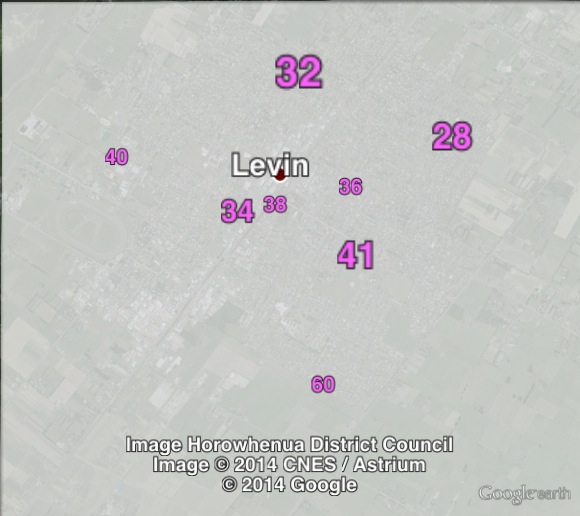
On the party vote, National again topped the poll in all five areas. National polled a majority in Paraparaumu and Waikanae, with the vote dropping to less than 40% in Levin.
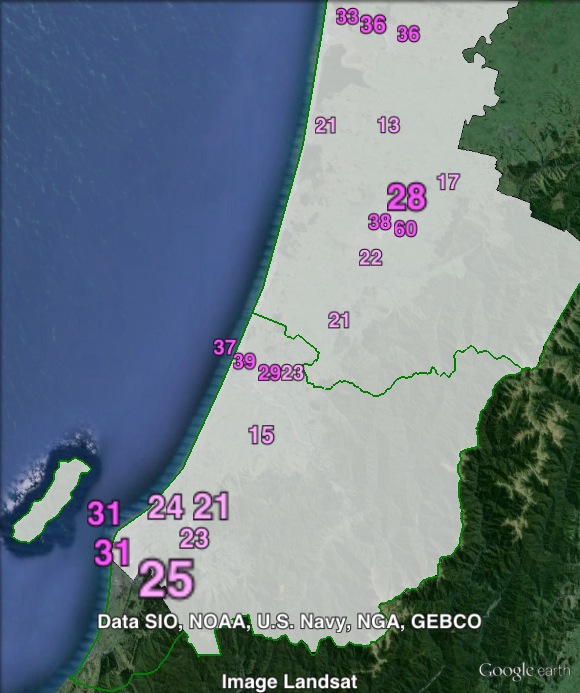
The Labour party vote ranged from 24.2% in Waikanae to 35.7% in Levin. The Green Party came third, with a vote ranging from 7% to 14%, while New Zealand First came fourth with a vote ranging from 6% to 10.8%. New Zealand First outpolled the Green Party in Levin and the North.
| Voter group | Electorate votes | Party votes | Total | % of votes | ||||
| NAT | LAB | NAT | LAB | GRN | NZF | |||
| Paraparaumu | 55.29 | 34.72 | 52.08 | 26.66 | 9.44 | 6.49 | 7,056 | 19.78 |
| Levin | 47.09 | 41.69 | 39.67 | 35.70 | 7.07 | 10.79 | 6,747 | 18.91 |
| Waikanae | 55.27 | 35.90 | 53.99 | 24.20 | 10.50 | 5.91 | 5,296 | 14.84 |
| North | 55.09 | 33.60 | 48.04 | 27.17 | 8.32 | 10.08 | 4,048 | 11.35 |
| Otaki | 47.92 | 38.71 | 44.16 | 27.49 | 14.01 | 8.46 | 3,214 | 9.01 |
| Other votes | 49.66 | 38.97 | 44.79 | 31.77 | 10.38 | 7.60 | 9,315 | 26.11 |
My prediction: The National Party should win here.