
Now that we have a complete two-party-preferred vote for all of Australia, we can look at the distribution of seat margins and swings across the country.
For this post, I have produced a number of charts which show the distribution of seats by two-party-preferred result, and also by two-party-preferred swing. I also attempt to chart out the two-candidate-preferred swings in non-classic seats, or at least those which have a valid swing compared to 2022.
For this post, my inspiration comes from some quite old charts that I have seen in Malcolm Mackerras’ analysis of elections as far back as 1972, when the concept of the pendulum was still being developed. This chart comes from Australian General Elections, which was Mackerras’ pre-election guide published in 1972.
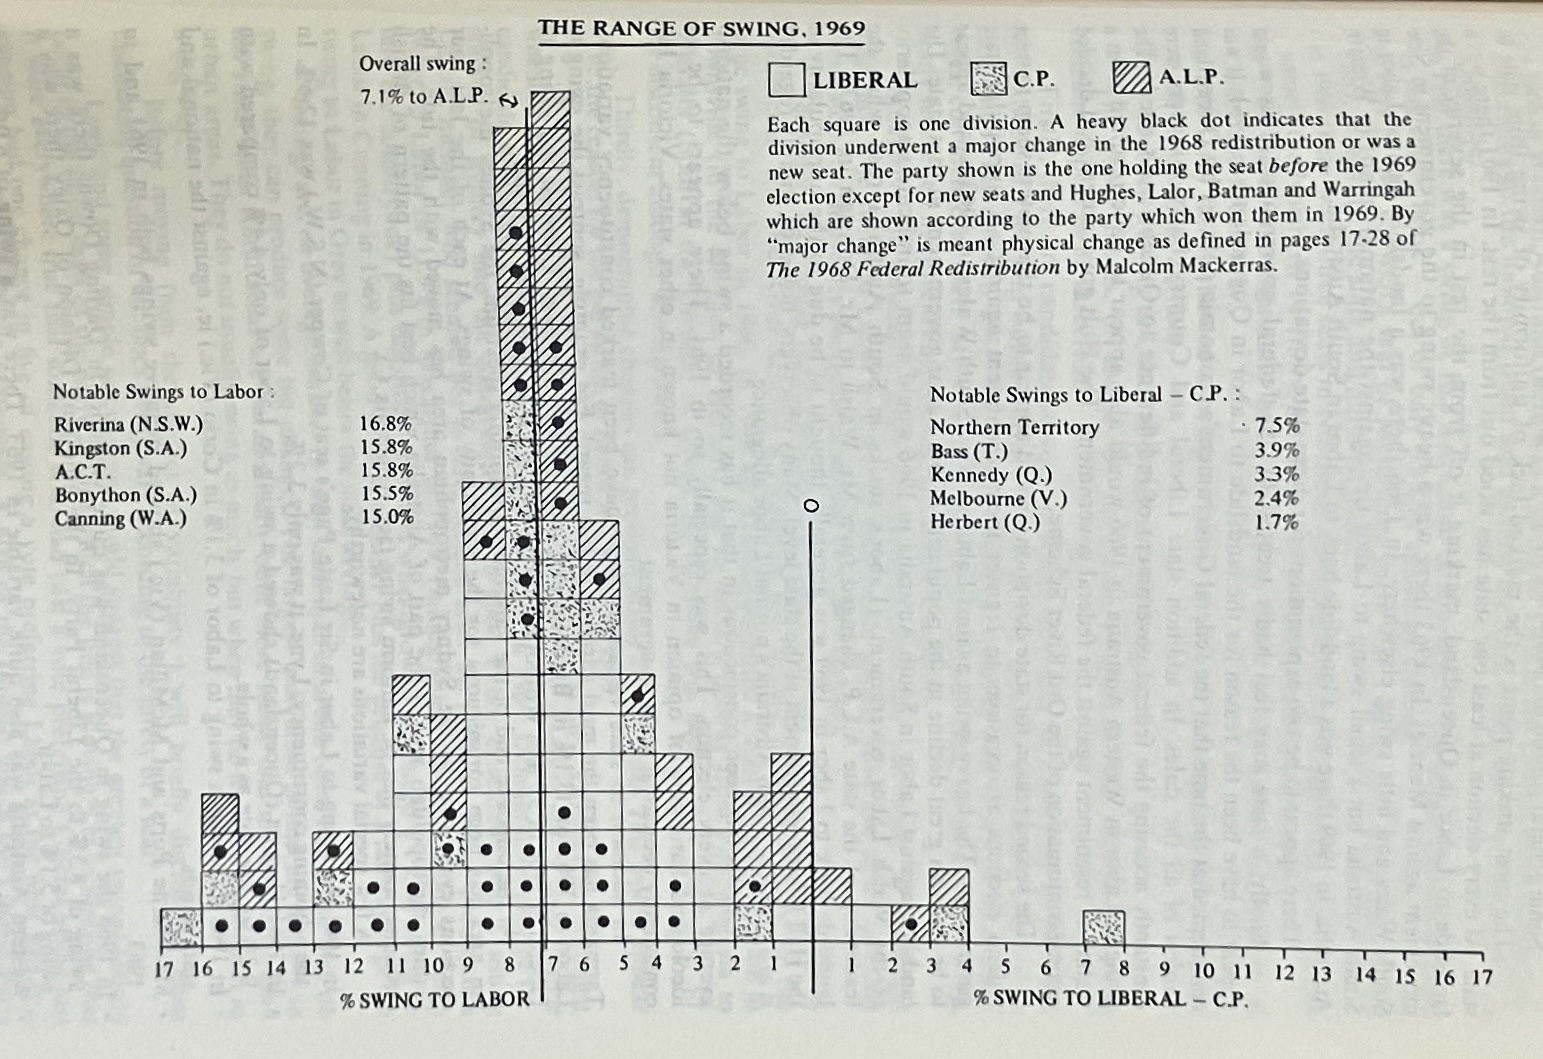
Charts like this can be used to assess how much the swing is skewed, and how tightly clustered swings are. In 1969, there is a large number of seats with swings of 5-9% to Labor.
For more recent data, I’m going to start with this chart showing the spread of two-party-preferred votes for Labor from 2004 to 2025 (not swing).
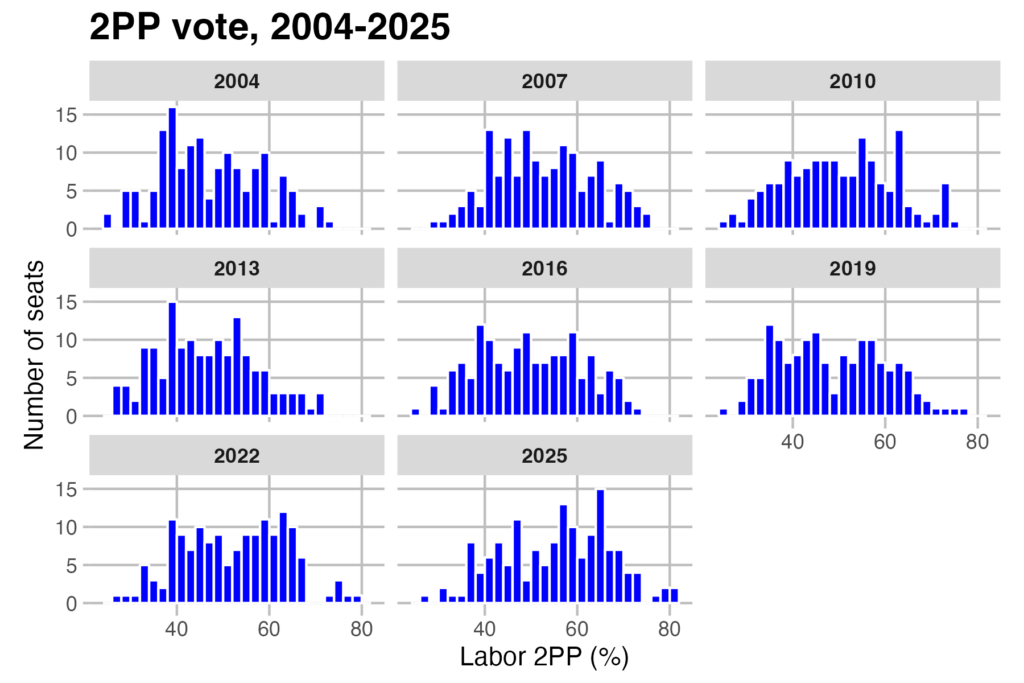
The charts are mostly flat within the range of competitive seat margins, but it is interesting that there does seem to be a reduced number of seats within the super-marginal range – there were very few Coalition seats with margins of 0-2% in 2019, and again in 2025.
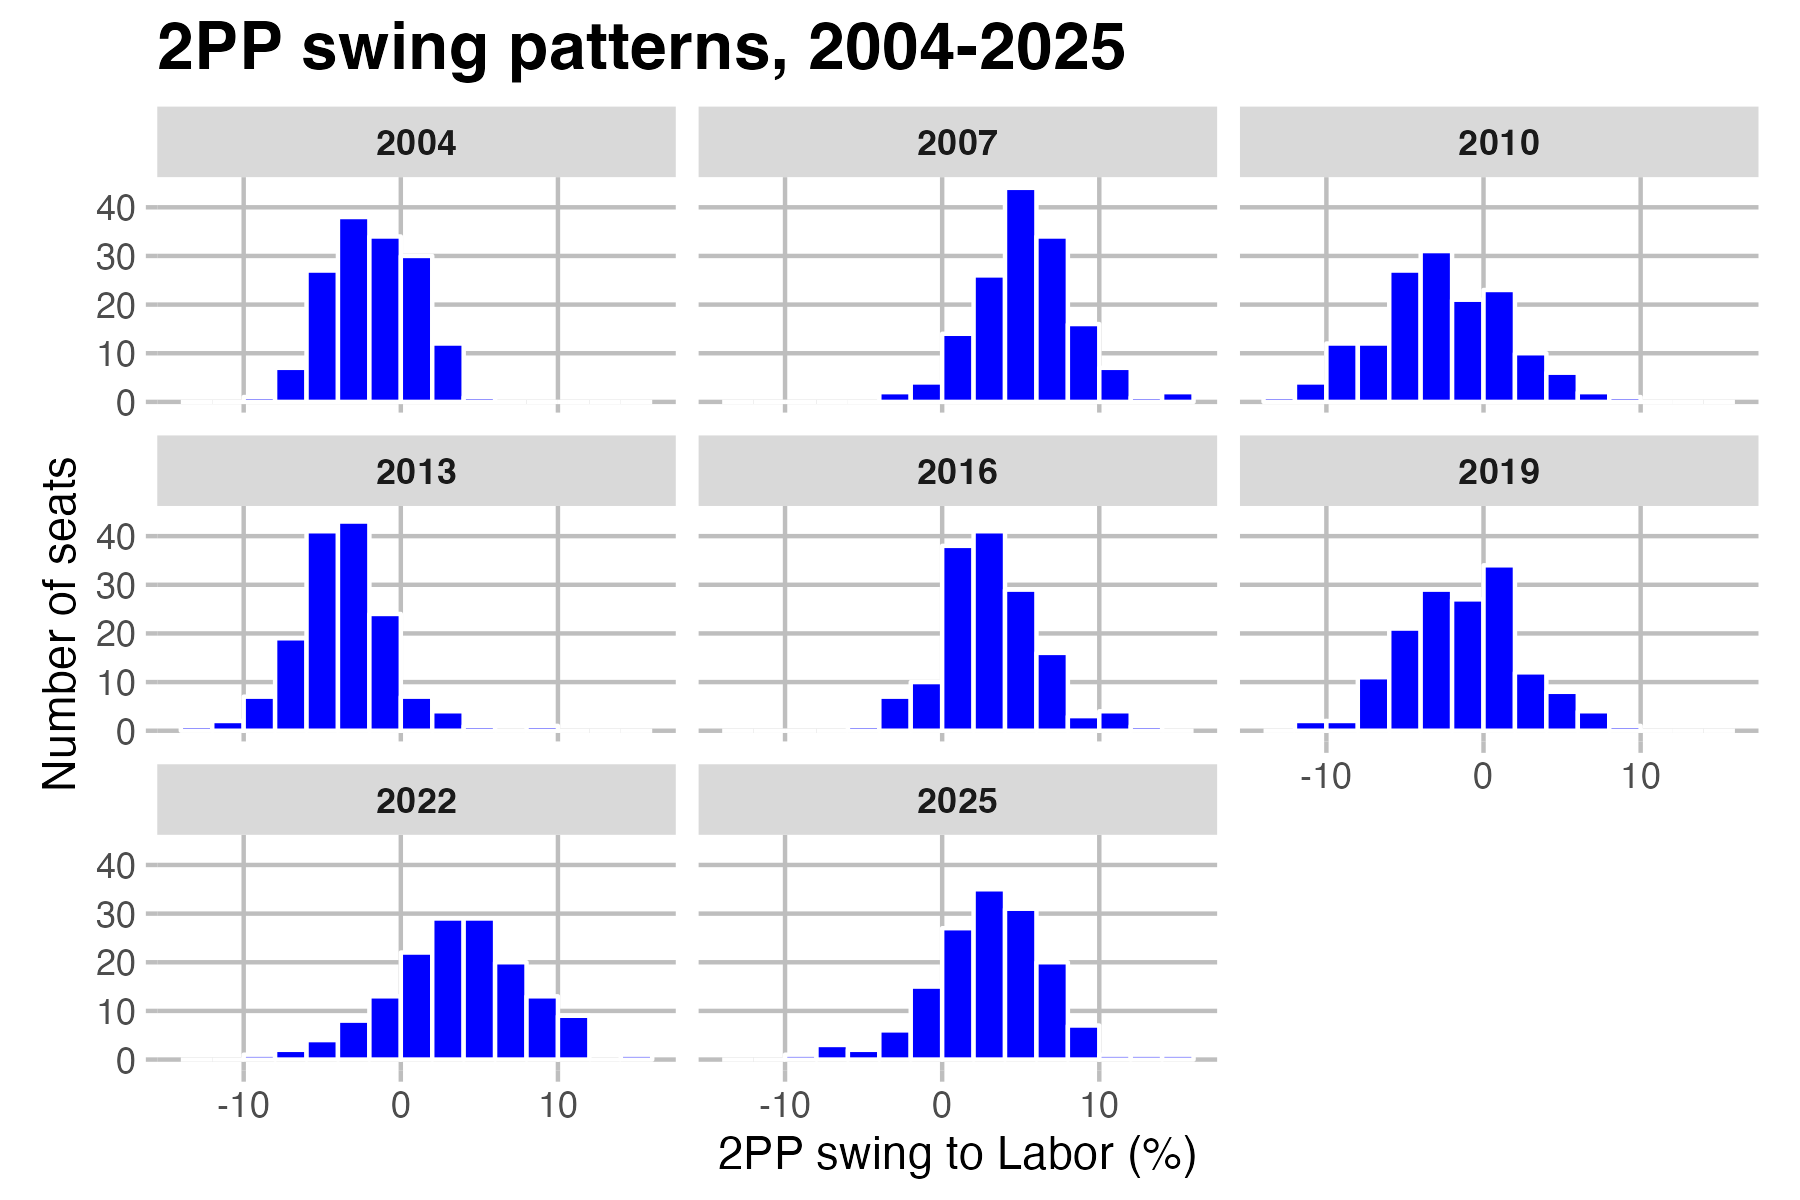
This next chart shows the swings, and is a bit more interesting. If the swings are tightly clustered together, it is easier to use the pendulum to assess the likely number of seats that would flip. When they spread out, particularly if they curve skews one way or the other, results can be more disproportionate. Swings were tightly clustered in 2013 and 2016, but much more spread out in 2019 and 2022. 2025 is a bit more tightly clustered, with a majority of seats having swings to Labor between 0% and 6%.
Everything we’ve looked at up until now has been based on two-party-preferred vote, which has the advantage of simplicity and comparability over a long time-frame – the 2PP has been counted for every seat since 1983 (barring Bradfield). But there are an increasing number of seats where the result isn’t determined by the 2PP.
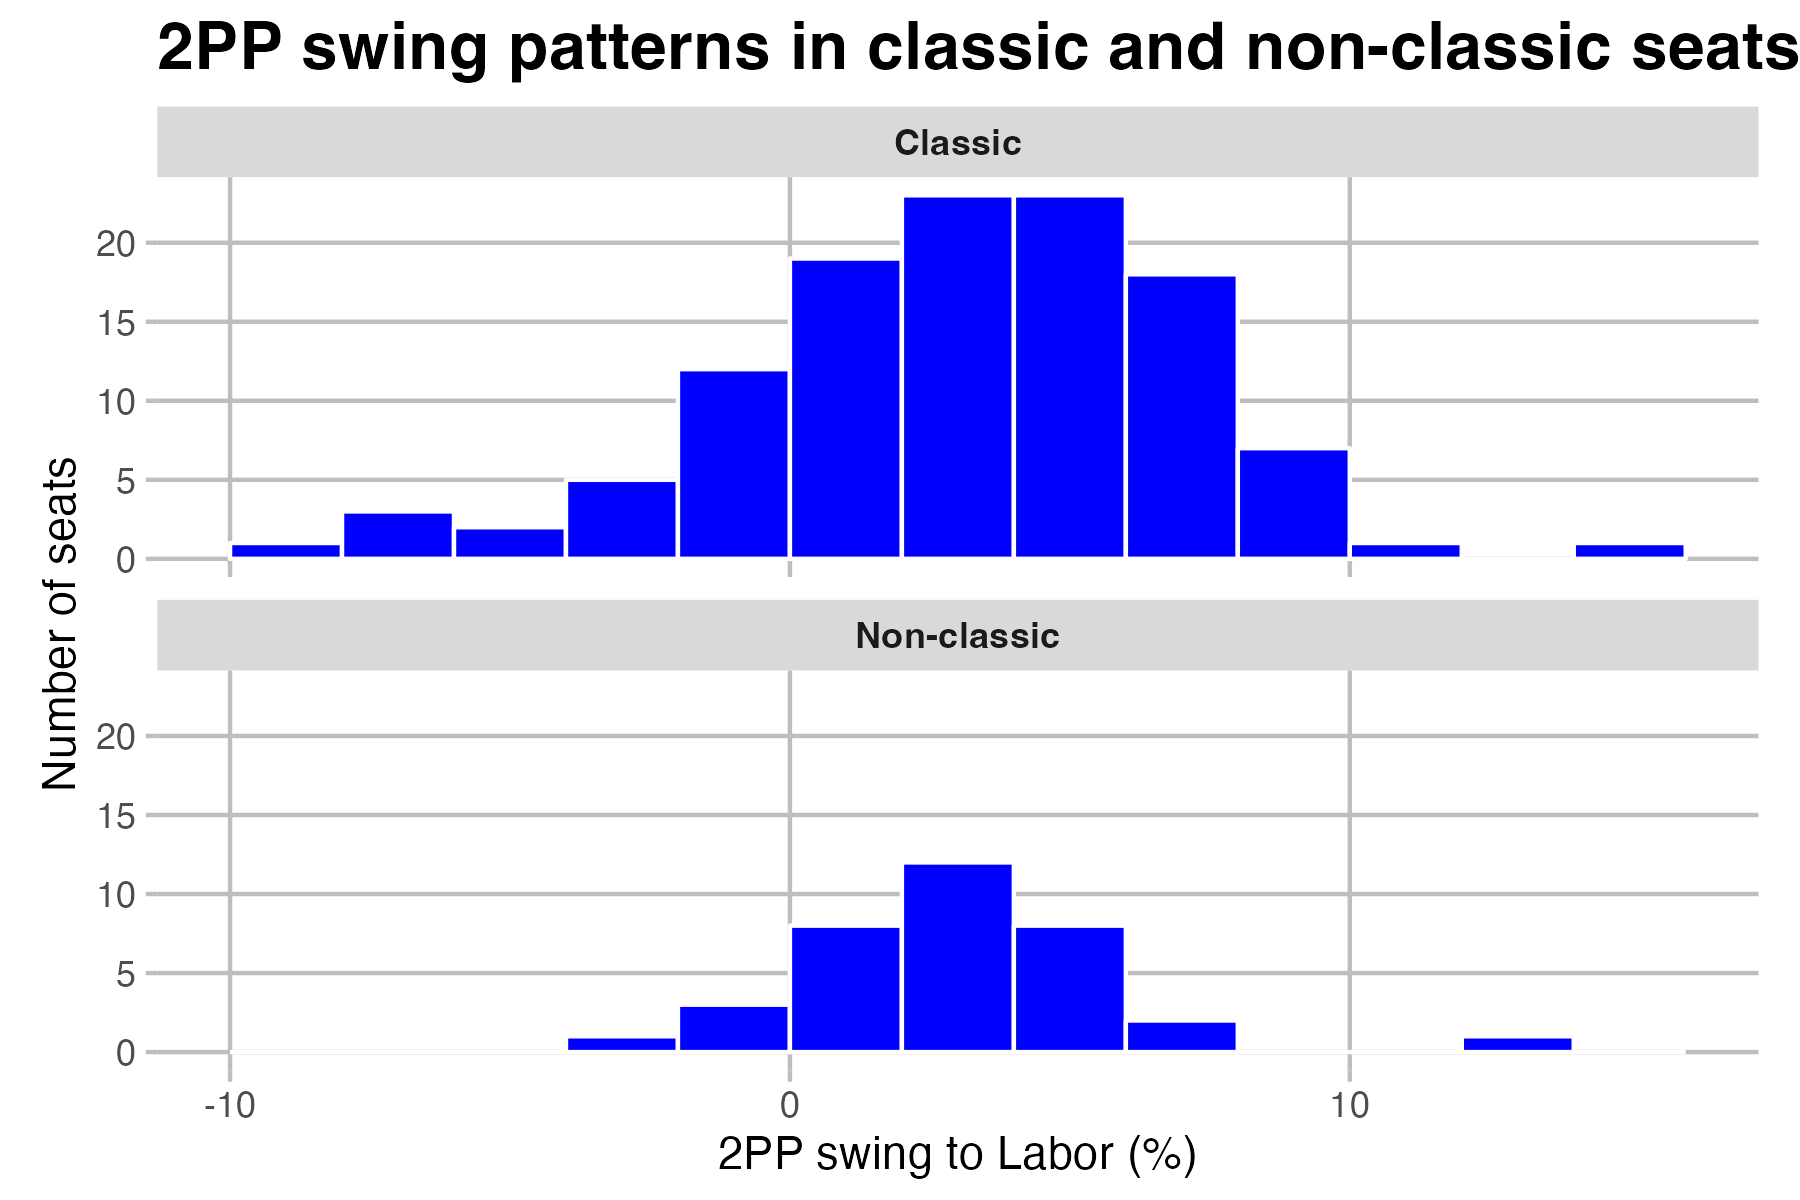
This next chart shows the 2PP swings (not 2CP swings) for all seats in 2025, split between classic and non-classic seats.
35 seats have ended up as non-classic in 2025. These seats generally have a similar pattern of swings as the classic seats, with most seats having swings of 0-6% to Labor. I know there has been some who have cast doubt on the meaningfulness of the 2PP figures in the non-classic seats but I think they are a meaningful indication of support on that metric.
Unfortunately there are quite a few non-classic seats where we don’t have a valid 2CP swing, because the 2CP pairing was different in 2022. Most of these are seats that used to be Labor vs Coalition races, but it also includes seats like Griffith and Fremantle where the the seat was already non-classic but has changed to a different combination. There are 14 seats with no valid swing – three Labor vs Greens races, 4 Coalition vs independent races and 7 Labor vs others races. There are nine races where it is Labor vs someone other than the Coalition or the Greens, and we only have a valid count in two. There just weren’t many of these races until 2025.
I should also note that the AEC’s 2CP and 2PP reports also treat Brisbane, Bendigo and Nicholls as having invalid swings because the 2CP pairing has changed, but there are pre-existing 2PP margins so I have adjusted these to have valid swings.
Despite these issues, I have attempted to make some mini-histograms showing the 2CP swings for each pairing.
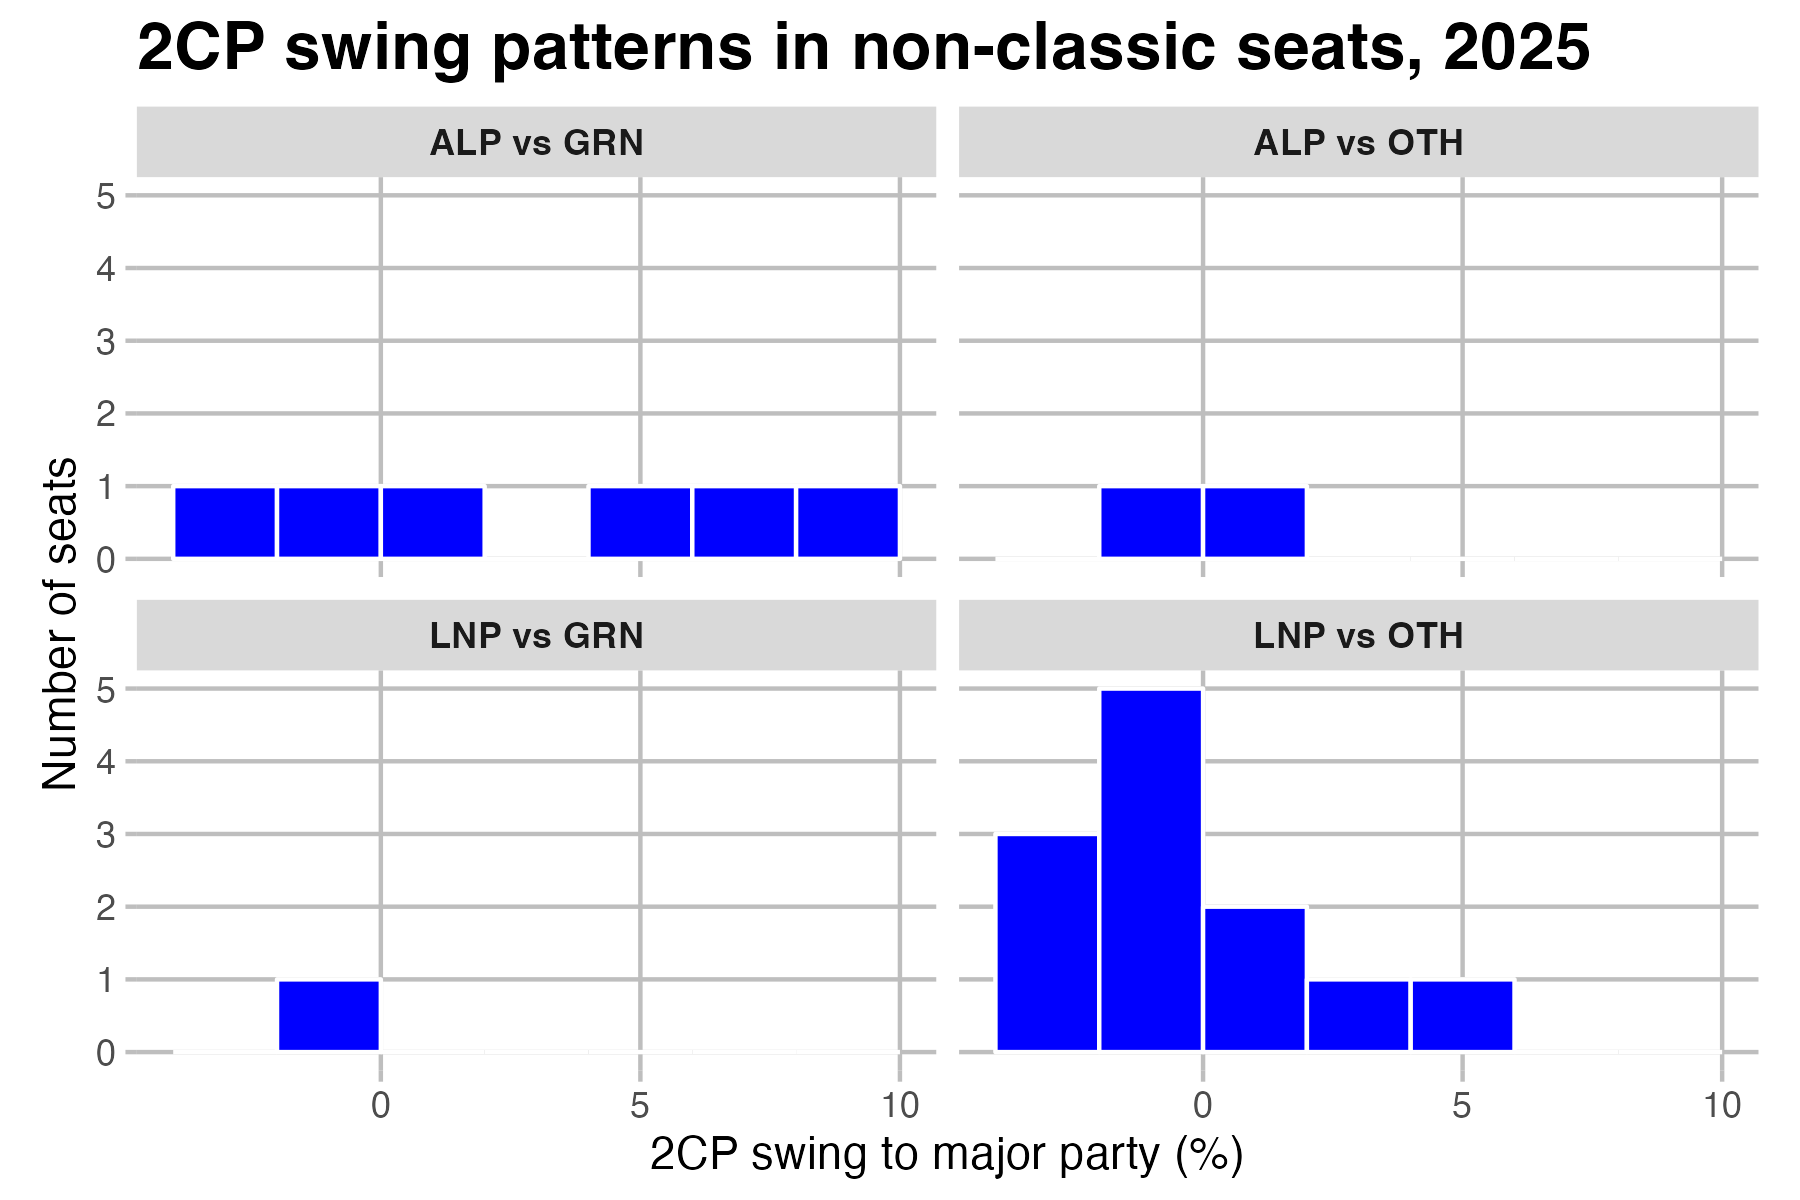
The seat of Ryan was unique as being a Coalition vs Greens contest. The only non-classic seats featuring Labor but not the Greens to have a valid swing were Clark and Fowler, and neither swung much.
The distribution of Labor vs Greens contests is all over the place. Labor went backwards in Grayndler and Wills, but forwards in Cooper, Sydney, Canberra and Melbourne.
The largest group of seats are those between the Coalition and others (mostly independents but also Bob Katter). There are valid swings for 12 seats, and the graph is starting to look like the typical swing graphs we typically see. The Coalition went backwards in eight seats, and forwards in four others. The Coalition went up slightly in Indi and Cowper, with the bigger swings in Kooyong and Goldstein.
Doing this research, along with some reading of previous analysis of federal elections, has made me wonder: how well does the pendulum apply to today’s election results?
The idea of the pendulum isn’t that it would necessarily predict the specific seats that would flip, but that applying the national swing to the pendulum will tell you the number of seats expected to change hands. Even if it doesn’t predict the number of seats perfectly, the idea that it will tell you roughly how many seats you’d expect to change hands. But it really only applies to a logic of two-party-preferred votes and classic Labor vs Coalition contests. So how does it work now?
Firstly, establishing some facts. Labor’s 2PP is now sitting on 55.25%, which is a swing of 3.12%.
If you look just at the two-party-preferred vote in each seat, Labor had the majority in 84 out of 150 seats using 2022 votes on the 2025 boundaries. This increased to 100 seats in 2025. That’s an increase of 16 seats (assuming they don’t win the 2PP in Bradfield). If you make a pendulum of 2PP only, a swing of 3.12% would be expected to flip 14 seats. So that means the pendulum comes within two seats of picking the result. But that’s not actual results.
If you look at the actual pendulum (you get the same result using my pendulum or Antony’s pendulum), a swing of 3.1% would flip eleven seats. But I think you should also include Aston, a seat that was held by a margin of less than 3.1% in 2022 (including after the redistribution. So the pendulum would have predicted 12 classic seats changing hands.
If you include Aston, Labor gained fourteen seats off the Coalition. So the pendulum was off by only two seats.
So as far as classic contests are concerned, the pendulum does a pretty good job of predicting the impact in seat changes. Of course, it does nothing to tell us how the non-classic seats will go, and they are an increasing share of the country (almost one quarter of seats in 2025), but it is still the case that a majority of competitive seats are between Labor and Coalition.
So yes, the pendulum is still useful, and an accurate two-party-preferred figure is still very useful.

As more and more non classic seats occur the pendulum will become less and less reliable.
There is a bigger fragmentation of the vote…. 35% 31?% and remainder approx 33% again in global figures.
In 2022, the swings to Labor were quite dispersed and varied. In WA, the swings to Labor were quite strong whilst in outer suburban electorates there were swings away from Labor following the pandemic. Labor got fewer swings away in 2025 and the vast majority went Labor’s way.
The nationwide 2PP swing to Labor in 2025 is 3.15%. In all of Labor’s pickups other than Menzies and Deakin, the swing was beyond that. Menzies was helped by a popular local Liberal MP.
A lot of seats that flipped e.g. Dickson, Leichhardt, Sturt, Melbourne (on a 2CP basis), were held by their opponents for 15+ years but their margins have gone straight to the 5% to 10% range for Labor. In Braddon and Bass, the swings were also far greater than necessary. Labor might’ve overcampaigned or Dutton and the Liberal brand were just too toxic in metropolitan areas and northern Tasmania and Far North QLD.
Votentate
Re; ‘ Labor got fewer swings away in 2025 ‘
I count 27 seats swinging to Coalition 12 in Victoria
4 in Queensland
6 in WA
1 in NT
4 in NSW
That’s 50% more ‘swings away from Labor’ than 2022
Will AEC ever get around to fixing the error in the Wodonga PPVC – remarkably it shows that only 1 of 3705 votes cast preferred Helen Haines over the Liberal candidate.
Honestly I think it might be getting too late for that correction. But I’ll send an email to the AEC to let them know.
Actually after checking this booth I remembered a comment from Kevin Bonham on my Discord (always the best place to find this stuff out!). He had checked this with the AEC. It turns out there was a mistake where the tallies for West Wodonga PPVC and Wodonga PPVC were mixed up. So the total numbers between the two booths are correct but there is no correct figure for one booth or the other. So nothing to do be done about it.
Phil, you might be right there.
I recall that 2022’s election was remarkable in itself. Labor suffered primary vote swings in various ‘red wall’ seats in suburban Sydney and Melbourne. Also, Labor fell out of the 2CP in many seats thanks to teal independents as well as the Greens in Ryan, Brisbane and Griffith.
Comments are closed.