
After the publication of the proposed boundaries for Victoria and Western Australia for the next federal election, I had a number of questions about how the boundaries would have looked on the 2019 votes, particularly in WA.
There was a big change in votes between 2019 and 2022 across Australia, but particularly in WA. There was a general swing to Labor, but this swing was much much bigger in WA, and the Labor vote is not expected to stay at that level.
So for this post I have taken my pre-existing dataset of election results from 2004 to 2022 broken down into small areas, and mapped them on to the 2025 electoral boundaries. In this post I focus on how the 2019, 2022 and 2025 electoral maps look different on the 2019 election results, and also look at how the 2022 and 2025 maps look different over a longer time period for a handful of particularly interesting seats.
For this post I am only going to be using two-party-preferred vote data. This is because 2PP is guaranteed to be available for all areas back to 2004, so you don’t need to tweak margins to account for missing votes, or have breaks in trends when the 2CP match-ups change.
If you’ve read my federal election guides for 2022 or 2025, you’ll have seen charts showing the actual 2PP result in each seat since 1984. It also includes a dotted green line which shows my estimate of the results since 2004 on the current boundaries. For seats that haven’t changed borders, this dotted green line disappears, but for others with significant changes it can tell an interesting story. Since it will be relevant later, here is my chart for Chisholm from 2022.
There’s a table at the end of this post which shows the actual 2019 margin in each seat, the notional margin using 2019 votes for the 2022 electoral boundaries, which changed in both states in question. And then finally it compares those figures to my estimate of the 2019 result on the proposed 2025 boundaries.
A few seats jump out as a point of interest.
The new seat of Bullwinkel is estimated to have a margin of 3.3% for the ALP based on 2022 results, but the 2019 results would make it a Liberal seat with a 7.5% margin. If there is much of a swing back to normality, you’d expect it to be a Liberal seat.
Chisholm is also of interest. The seat was the most significantly changed in Victoria, with Labor’s 6.4% margin almost halving. The Liberal Party had narrowly held on in 2019, but on the new boundaries they would have won by a much more comfortable 3% margin.
It’s worth pausing on Hasluck, the pre-existing WA seat that was changed the most dramatically. The Labor margin has increased from 6% to 10.1%. The 2022 boundaries had a notional margin of 5.9% for the Liberal Party, which means we saw a swing of about 12% in 2022. But if you were to apply the 2019 results to the new Hasluck, it has a Liberal margin of 0.3%.
This next chart shows a selected group of twelve seats and compares the results over the last two decades for the 2022 and 2025 boundaries.
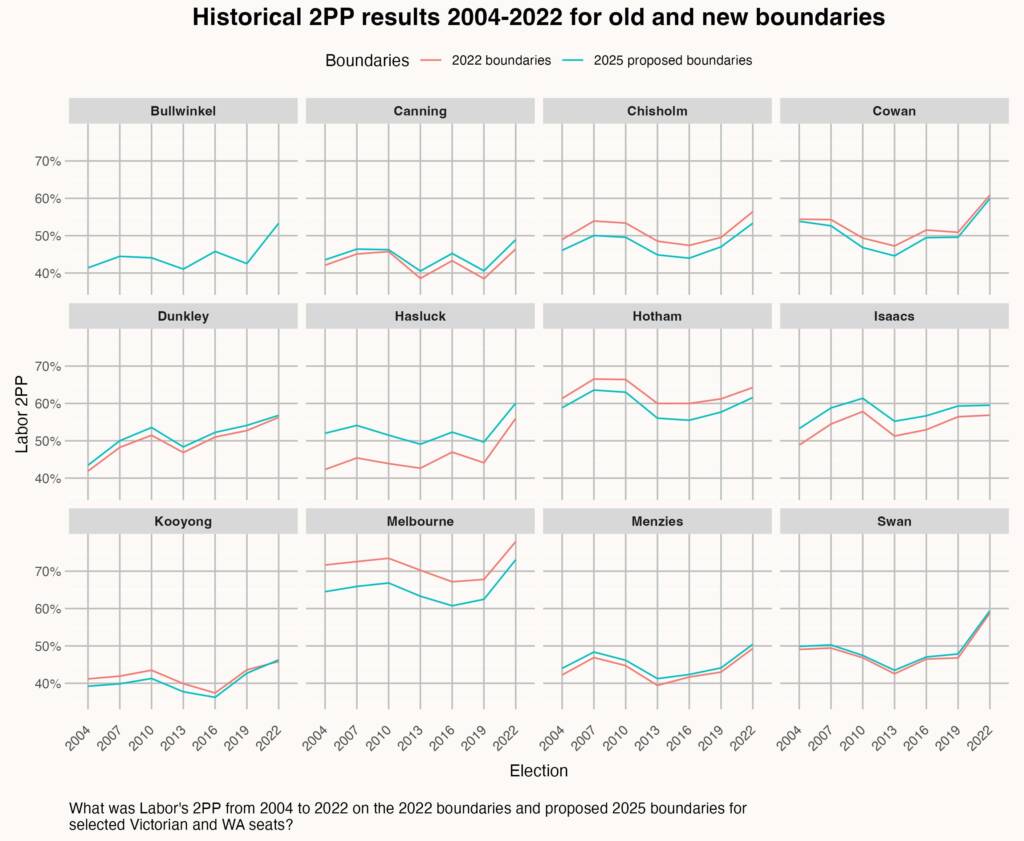
Chisholm has become significantly stronger for the Liberal Party following the changes, which followed another change prior to the 2019 election that also made the seat more Liberal-friendly. This has now reached a point that the new Chisholm boundaries would have just barely elected Labor at their peak in 2007, and would have given the Liberal Party 55.1% in 2013. In reality they only managed 48.4% in that seat at that time.
There are a number of other seats which have shifted by a noticeable margin, but that shift has been consistent for all results over this time period. Hotham has become weaker for Labor, while Isaacs has become stronger. The change is smaller in Menzies, Canning, Cowan and Dunkley, while there has been barely any change in Swan.
There are some seats which have begun to diverge more in their results between their old and new boundaries, such as Canning, while Dunkley, Cowan, Menzies and Kooyong’s changes would have shifted their margin more if these changes had taken place a decade ago. It’s particularly interesting to see that Kooyong’s 2PP margin barely shifted with this change, but in the past this change would’ve made the seat weaker for the Liberals.
Finally, the seat of Bullwinkel gives a sense of how that area would have voted over a longer time frame. 2022 was the only election that produced a Labor majority – indeed Labor just barely exceeded 45% in 2016, and at no other election since 2004.
That’s about it for this post, but I’ll look to do some similar analysis for the NSW redistribution.
| Seat | 2019 map | 2022 map | 2025 map |
| Aston | LIB 10.1% | LIB 10.1% | LIB 9.5% |
| Ballarat | ALP 11.0% | ALP 10.3% | ALP 10.2% |
| Bendigo | ALP 9.0% | ALP 8.9% | ALP 8.7% |
| Bruce | ALP 14.2% | ALP 7.3% | ALP 6.1% |
| Calwell | ALP 18.8% | ALP 19.6% | ALP 19.5% |
| Casey | LIB 4.6% | LIB 4.6% | LIB 4.6% |
| Chisholm | LIB 0.6% | LIB 0.5% | LIB 3.0% |
| Cooper | ALP 26.3% | ALP 26.2% | ALP 26.3% |
| Corangamite | ALP 1.1% | ALP 1.0% | ALP 1.2% |
| Corio | ALP 10.3% | ALP 10.3% | ALP 9.9% |
| Deakin | LIB 4.8% | LIB 4.7% | LIB 4.8% |
| Dunkley | ALP 2.7% | ALP 2.7% | ALP 4.1% |
| Flinders | LIB 5.6% | LIB 5.6% | LIB 5.7% |
| Fraser | ALP 14.2% | ALP 18.1% | ALP 18.2% |
| Gellibrand | ALP 14.8% | ALP 13.0% | ALP 12.4% |
| Gippsland | NAT 16.7% | NAT 16.7% | NAT 16.7% |
| Goldstein | LIB 7.8% | LIB 7.8% | LIB 6.6% |
| Gorton | ALP 15.4% | ALP 14.3% | ALP 14.3% |
| Hawke | ALP 10.2% | ALP 10.2% | |
| Higgins | LIB 3.9% | LIB 3.7% | |
| Holt | ALP 8.7% | ALP 8.9% | ALP 8.9% |
| Hotham | ALP 5.9% | ALP 11.2% | ALP 7.7% |
| Indi | LIB 12.7% | LIB 12.7% | LIB 12.7% |
| Isaacs | ALP 6.4% | ALP 6.4% | ALP 9.3% |
| Jagajaga | ALP 6.6% | ALP 5.9% | ALP 6.0% |
| Kooyong | LIB 6.7% | LIB 6.4% | LIB 7.3% |
| La Trobe | LIB 4.5% | LIB 5.4% | LIB 5.2% |
| Lalor | ALP 12.4% | ALP 12.4% | ALP 12.5% |
| Macnamara | ALP 6.2% | ALP 6.1% | ALP 6.3% |
| Mallee | NAT 16.2% | NAT 15.7% | NAT 15.6% |
| Maribyrnong | ALP 11.2% | ALP 10.3% | ALP 11.0% |
| McEwen | ALP 5% | ALP 5.3% | ALP 5.4% |
| Melbourne | ALP 17.1% | ALP 17.8% | ALP 12.5% |
| Menzies | LIB 7.5% | LIB 7.0% | LIB 5.9% |
| Monash | LIB 7.4% | LIB 6.9% | LIB 6.9% |
| Nicholls | NAT 20.0% | NAT 20.0% | NAT 18.6% |
| Scullin | ALP 21.7% | ALP 21.7% | ALP 21.5% |
| Wannon | LIB 10.4% | LIB 10.2% | LIB 9.9% |
| Wills | ALP 25.9% | ALP 25.7% | ALP 25.7% |
| Brand | ALP 6.7% | ALP 6.7% | ALP 7.1% |
| Bullwinkel | LIB 7.5% | ||
| Burt | ALP 5.0% | ALP 5.5% | ALP 4.0% |
| Canning | LIB 11.6% | LIB 11.6% | LIB 9.4% |
| Cowan | ALP 0.8% | ALP 0.9% | LIB 0.4% |
| Curtin | LIB 14.3% | LIB 13.9% | LIB 14% |
| Durack | LIB 14.8% | LIB 13.5% | LIB 14.4% |
| Forrest | LIB 14.6% | LIB 14.6% | LIB 14.5% |
| Fremantle | ALP 6.9% | ALP 6.9% | ALP 6.6% |
| Hasluck | LIB 5.4% | LIB 5.9% | LIB 0.3% |
| Moore | LIB 11.7% | LIB 11.6% | LIB 11.7% |
| O’Connor | LIB 14.5% | LIB 15.4% | LIB 14.9% |
| Pearce | LIB 7.5% | LIB 5.2% | LIB 5.9% |
| Perth | ALP 4.9% | ALP 3.2% | ALP 2.4% |
| Stirling | LIB 5.6% | ||
| Swan | LIB 2.7% | LIB 3.2% | LIB 2.2% |
| Tangney | LIB 11.5% | LIB 9.5% | LIB 9.0% |

“….and the Labor vote is not expected to stay at that level”.
Says who?
Why is 2019 a better reflection of the will of voters than 2022?
Just because you had a number a questions about it Ben, doesn’t mean they are worthwhile questions to spend time on. This notion that electoral results revert to a “mean” and that you can self select when that mean occurred, is delusional.
@High Street because the swing to Labor in WA in 2022 was inflated by the massive swing Mark McGowan got at the 2021 state election where he was re-elected in a second-consecutive landslide with a historic majority. The TPP swing to Labor in WA was over 10% which is higher than it was anywhere else.
@high street we arent suggesting they will return to 2019 levels but nor will they stay at 2022 levels they will settle somewhere in between
So if the 2019 election was run on these boundaries you’d get
Libs (77 seats)
– Higgins (abolished)
– Stirling (abolished)
+ Bullwinkle (new seat)
+ Cowan
Lab (68 seats)
– Cowan
+ Hawke (new seat)
So no change at all… well at least until NSW have it’s redistribution. Important to keep in mind whenever people talk about how much redistributions favour one side or another.
@drake your also forgetting the loss of hasluck
nvm that i read it wrong
Based on these results id put tangey, Swan and Bullwinkle in the lib gain in WA. with Swan, Cowan in the “in play” hasluck will probably be a labor retain albeit with reduced margin and marginal. the remaining coalition seat shoulr return to safe margins and as for the remaining abor divisions they should return to “safe”
John, did you mean Tangney and Bullwinkle as the likely Lib gains for WA (as you said Swan twice). I do agree with that assessment that Swan and Cowan would become ‘toss-up’ seats at risk of being lost by Labor
Very useful analysis, thanks. Bullwinkel is very similar to Pearce in its original form 1990-2001 when it was held comfortably by Fred Chaney and Judi Moylan. Swan has almost the same boundaries as at the 2010 and 2013 elections.
@High Street, I am not suggesting that WA will return to the vote seen in 2019. I suspect it will be somewhere in between, but we have polling and the historical record of how aberrant WA’s position relative to the rest of the country was in 2022.
@yoh i meant pearce instead of swan as a gain
Why is Melbourne Labor, and why is Nicholls Liberal instead of Nats??????
@daniel its based on 2PP not 2CP
Nicholls is a mistake, but I made it clear that the rest of it is 2PP, so every seat is either Labor or Coalition.
ive calculated the median of all the WA seats comparing 2022 to 2019 on the new boundaries and came up with the following
Brand 12.1% ALP
Bullwinkle 2.1% LIB
Burt 8.65% ALP
Canning 5.25% LIB
Cowan 4.75% ALP
Curtin 9.8% LIBvALP
Durack 9.5% LIB
Forrest 9.35% LIB
Fremantle 11.65% ALP
Hasluck 4.9% ALP
Moore 6.3% LIB
O’Connor 10.8% LIB
Pearce 1.45% ALP
Perth 8.2% ALP
Swan 3.6% ALP
Tangey 3% LIB
based on these medians il predict Tangey, Curtin and Bullwinkle will be Liberal gains with Pearce a likely gain and Swan, Cowan and Hasluck as competitive
@john might be a bit disingenuous to suggest Curtin will fall based on 2019 numbers considering it was a completely different contest.
@mostly it works out to a 4.2% increase on the 2pp so based on that I think the libs will win the seat. Kate Chaney only won on the back of the over inflated vote so I think the seat is vunerable enough to drop
is it just me or does anyone else also think Labor always under performs in Swan despite Swan on paper having a relatively good demographic for Labor specially around Vic Park, Belmont and Cannington areas.
@John good calculations. I agree that those will be the most likely gains but we’ll see as Tangney has a large Chinese community (I think it’s got the largest Chinese community in WA).
Interestingly in 2016 and 2019 the seat of Perth itself was actually won by Labor on Greens preferences as the Liberals finished first at both of those elections. I’m curious to hear your thoughts on what might happen with Perth in 2025?
@Np if it was based on 2019 result id rate it as a possible pickup but given the over inflated vote id say it will around what ive calculated. maybe a possible gain in 2028
@john, Curtin was Liberal held due to the money factor – it’s one of the wealthiest electorates in the country.
It is also however, one of the more socially progressive seats in WA, and probably the country (I saw something once that rated it only behind Fremantle in WA), which does not match up to the current “Liberal” Party (who I don’t think anyone would describe as actually being liberal).
I suspect that even with a swing to the Libs in WA, which is likely but certainly not certain, Chaney would be able to hold this specific seat. Particularly as she’s a scion of the old, relatively progressive Liberals that WA used to churn out in the days before the Clan took over the party and ruthlessly turned it religious right.
@matt it depends really i think a small swing would do it they only need a small portion of people to change to liberals of chaney to win the seat. remember that she really only got in on the abnormal swing in wa
also can we expect NSW to be added to this post?
Comments are closed.