LIB 14.3%
Incumbent MP
Louise Asher, since 1999.
Geography
Southern Melbourne. Brighton covers the northern half of Bayside local government area, and a small part of the City of Port Phillip. The seat covers the suburbs of Brighton, Elwood and Hampton.
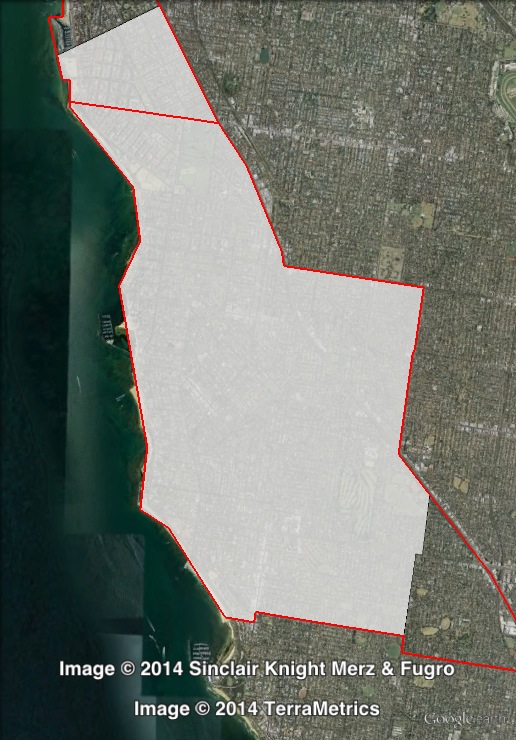
Redistribution
Brighton shifted slightly to the north, losing Hampton East to Bentleigh, and gaining Elwood from Albert Park. These changes cut the Liberal margin from 17.6% to 14.3%.
History
Brighton has existed as an electoral district ever since the creation of the Victorian Legislative Assembly in 1856. The seat has never been held by a Labor MP, and has been almost always held by the Liberal Party for the last century.
Brighton was held by unaligned members of Parliament from 1856 to 1909. Sir Thomas Bent had held the seat for 32 of the previous 38 years, but died in 1909.
The 1909 by-election was won by Liberal candidate Oswald Snowball. He held the seat for the Liberal and Nationalist parties for almost two decades. In 1927 he was elected Speaker of the Legislative Assembly, and he retained that role until his death in 1928.
The 1928 by-election was won by Ian MacFarlan. He served as a member of the Nationalists and United Australia Party, although he served as an independent from 1937 to 1943. He served as deputy leader of the UAP and Liberal Party from 1943 to 1945, when he led a breakaway group of Liberals that brought down the state government of Albert Dunstan. He was briefly appointed as Premier, but lost his seat at the 1945 election.
MacFarlan was defeated in Brighton by Liberal candidate Raymond Tovell. He served as a Liberal Party member until 1953, when he was expelled from his party over his support for former Liberal Premier Thomas Hollway, who had created a breakaway ‘Electoral Reform League’ campaigning to end malapportionment of electoral boundaries. Tovell lost his seat in 1955.
Tovell was defeated by John Rossiter, who held the seat for the Liberal Party from 1955 to 1976, when he retired. He was succeeded by Jeannette Patrick, who held the seat until 1985.
Brighton was won in 1985 by barrister Alan Stockdale. When the Liberal Party came to power in 1992, Stockdale became Treasurer. He served in that role until his retirement at the 1999 election.
Louise Asher won Brighton in 1999. Asher had previously held the upper house seat of Monash since 1992. Asher served as a junior minister in the second term of the Kennett government. After the 1999 election she served as Liberal deputy leader and Shadow Treasurer until just before the 2002 election. She has continued as a frontbencher ever since, and returned to the deputy leadership in 2006.
Candidates
- Louise Asher (Liberal)
- Jane Touzeau (Independent)
- Margaret Beavis (Greens)
- Louise Crawford (Labor)
Assessment
Brighton is a safe Liberal seat.
2010 election result
| Candidate | Party | Votes | % | Swing | Redist |
| Louise Asher | Liberal | 21,375 | 62.51 | +7.6 | 59.19 |
| Tom Daley | Labor | 6,661 | 19.48 | -6.27 | 20.15 |
| Margaret Beavis | Greens | 5,465 | 15.98 | +2.69 | 17.02 |
| Laurence Giddings | Family First | 353 | 1.03 | -0.77 | 1.01 |
| A.L. Thompson | Independent | 343 | 1.00 | +1 | 0.82 |
| Sex Party | 0.49 | ||||
| Other independents | 1.32 |
2010 two-party-preferred result
| Candidate | Party | Votes | % | Swing | Redist |
| Louise Asher | Liberal | 23,091 | 67.56 | +6.63 | 64.3- |
| Tom Daley | Labor | 11,089 | 32.44 | -6.63 | 35.70 |
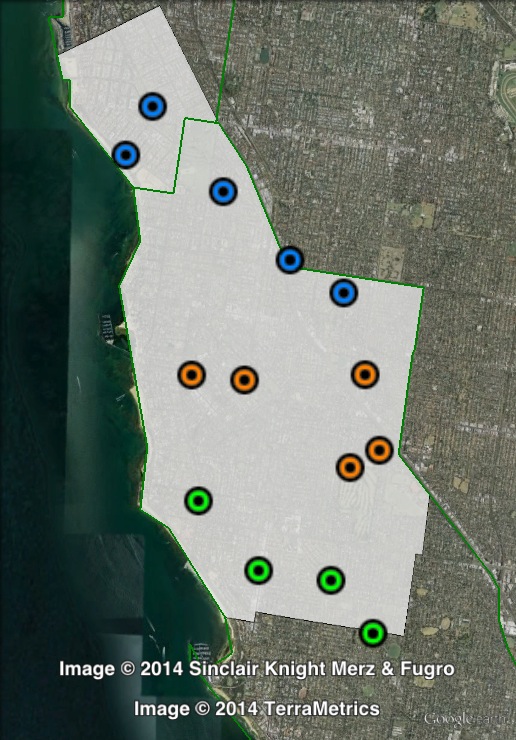
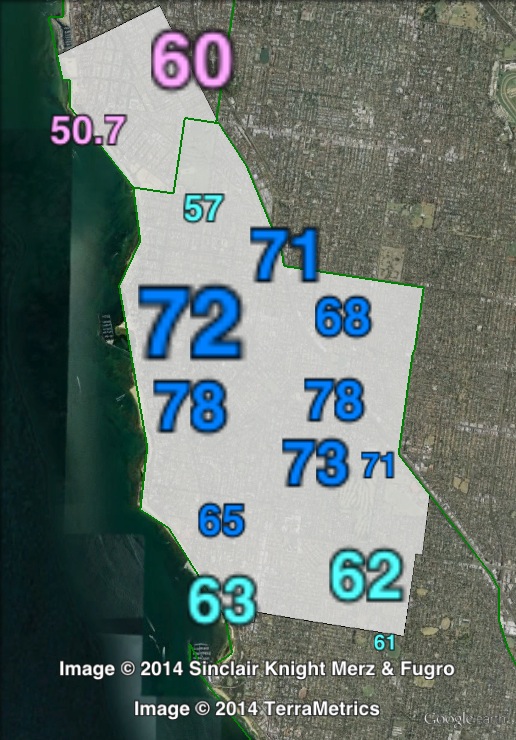
Booth breakdown
Booths in Brighton have been divided into three areas: central, north and south.
The Liberal Party won a majority of two-party-preferred votes ranging from 56.7% in the north to 74.3% in the centre.
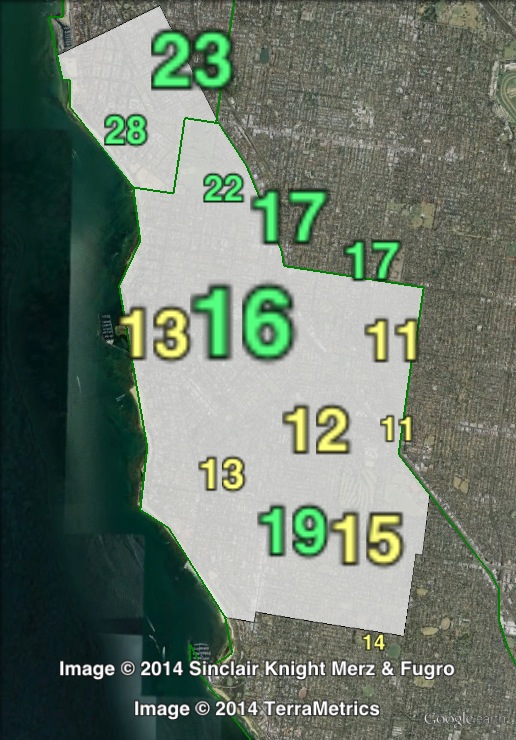
The Greens polled almost 16% in Brighton (17% after the redistribution), with a vote ranging from 13.2% in the centre to 20.8% in the north.
| Voter group | GRN % | LIB 2PP % | Total | % of votes |
| Central | 13.22 | 74.33 | 9,908 | 27.28 |
| North | 20.82 | 56.71 | 8,657 | 23.84 |
| South | 16.19 | 62.91 | 5,738 | 15.80 |
| Other votes | 17.82 | 63.91 | 12,014 | 33.08 |
Port Phillip, Point Ormond Ward, councillor Jane Touzeau has nominated.
Here is Jane Touzeau’s website
http://janetouzeau.com/
Jane was campaigning on a single issue “fracking”. It would appear Brighton voters have said “frack it” with Jane getting less than 4% of the vote