Council margin – LNP 21.0%
Mayoral margin – LNP 23.7%
Incumbent councillor
Matthew Bourke, since 2008.
Geography
South-western Brisbane. Jamboree covers suburbs along the southern shore of the Brisbane River from Seventeen Mile Rocks to the council boundary, including Jindalee, Mount Ommaney, Westlake, Riverhills and Sinnamon Park.
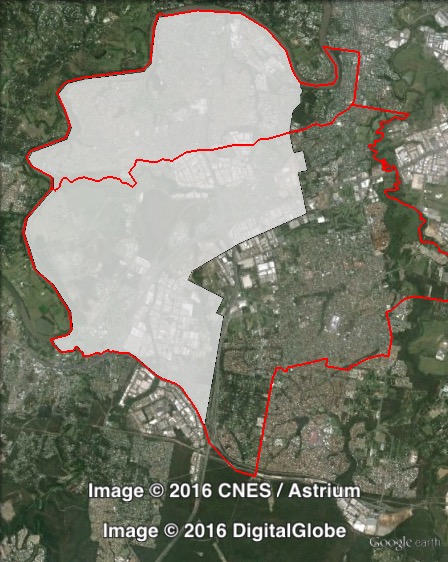
Redistribution
Jamboree shifted south, gaining Darra, Ellen Grove and Wacol from Richlands, and losing Corinda to Tennyson. These changes cut the LNP council margin from 26.8% to 21%, and cut the LNP mayoral margin from 27.6% to 23.3%.
History
Jamboree was held by Labor councillor Felicity Farmer by the year 2000, although it’s unclear how long she held the ward prior to that point.
Farmer was re-elected in 2004 with a 6.6% margin. In 2008, she lost Jamboree to Liberal candidate Matthew Bourke with a 7.8% swing. Bourke was left with a slim 1.5% margin.
In 2012, Bourke retained his marginal ward with a massive 25.3% swing after preferences. He currently serves as Chairman of the Environment, Parks and Sustainability Committee.
Candidates
- Matthew Johns (Labor)
- Dorotee Braun (Greens)
- Matthew Bourke (Liberal National)
Assessment
Jamboree has a recent history as a marginal ward, and if the 2012 swing was reversed the ALP would win the ward. But a 21% margin is still very difficult to imagine being overturned, particularly as it seems that Labor is not running a high-profile campaign.
2012 council result
| Candidate | Party | Votes | % | Swing | Redist |
| Matthew Bourke | Liberal National | 14,584 | 72.7 | +23.2 | 67.7 |
| Fran Bell | Labor | 3,982 | 19.8 | -25.8 | 26.0 |
| Jos Hall | Greens | 1,507 | 7.5 | +2.5 | 6.3 |
| Informal | 387 | 1.9 |
2012 council two-party-preferred result
| Candidate | Party | Votes | % | Swing | Redist |
| Matthew Bourke | Liberal National | 14,757 | 76.8 | +25.3 | 71.0 |
| Fran Bell | Labor | 4,458 | 23.2 | -25.3 | 29.0 |
| Exhausted | 1,784 |
2012 mayoral result
| Candidate | Party | Votes | % | Swing | Redist |
| Graham Quirk | Liberal National | 14,504 | 72.3 | +6.0 | 68.4 |
| Ray Smith | Labor | 3,746 | 18.7 | -7.9 | 22.3 |
| Andrew Bartlett | Greens | 1,508 | 7.5 | +2.6 | 7.4 |
| Rory Killen | Independent | 185 | 0.9 | +0.9 | 1.2 |
| Chris Carson | Independent | 121 | 0.6 | +0.6 | 0.7 |
| Informal | 409 | 2.0 |
2012 mayoral two-party-preferred result
| Candidate | Party | Votes | % | Swing | Redist |
| Graham Quirk | Liberal National | 14,701 | 77.6 | +7.0 | 73.7 |
| Ray Smith | Labor | 4,243 | 22.4 | -7.0 | 26.3 |
| Exhausted | 1,120 |
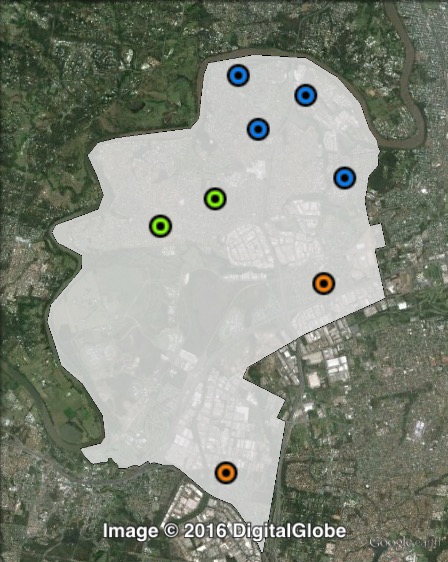
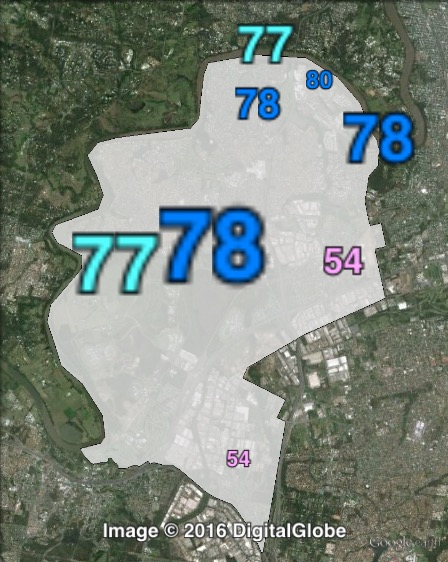
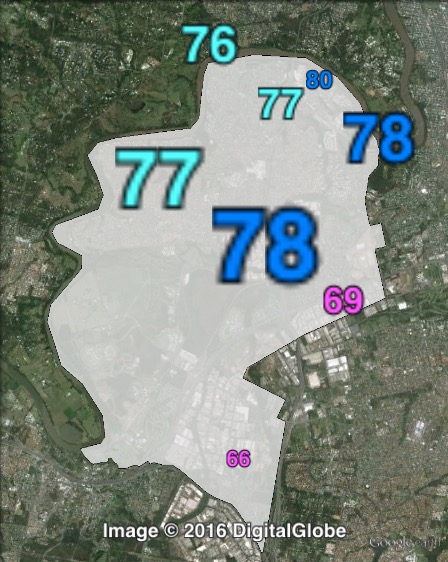
Booth breakdown
Booths in Jamboree have been divided into three parts: central, north and south.
The LNP won around 77-78% of the two-party-preferred vote in the north and centre for both the council and mayoral elections. These two areas make up most of the council population.
The two southern booths were previously in the Labor ward of Richlands, and in that area Labor won 67.8% of the council 2PP and 54.2% of the mayoral 2PP.
| Voter group | LNP council 2PP | LNP mayoral 2PP | Total votes | % of votes |
| North | 77.5 | 77.9 | 7,467 | 33.8 |
| Central | 77.5 | 77.7 | 7,171 | 32.5 |
| South | 32.2 | 45.8 | 2,396 | 10.8 |
| Other votes | 69.7 | 74.7 | 5,051 | 22.9 |