Last night’s Vasse state by-election in Western Australia was narrowly won by the Liberal Party, after a large surge in support for the Nationals. In 2013, the ALP came second and the Liberal Party easily won with 71.2% of the two-party-preferred vote.
Labor did not run in yesterday’s by-election, and most of Labor’s vote flowed to the Greens, who came close to doubling their vote.
2014 result
| Candidate | Party | Votes | % | Swing |
| Libby Mettam | Liberal | 8,665 | 44.4 | -12.9 |
| Peter Gordon | Nationals | 5,573 | 28.5 | +21.2 |
| Michael Baldock | Greens | 3,496 | 17.9 | +7.9 |
| Peter Johnson | Independent | 853 | 4.4 | +4.4 |
| Wayne Barnett | Australian Christians | 680 | 3.5 | +3.5 |
| Teresa Van Lieshout | Independent | 265 | 1.4 | +1.4 |
| Labor | 0 | 0.0 | -12.4 | |
| Independent | 0 | 0.0 | -11.0 | |
| Family First | 0 | 0.0 | -2.0 |
2014 two-candidate-preferred result
| Candidate | Party | Votes | % | Swing |
| Libby Mettam | Liberal | 10,435 | 53.4 | |
| Peter Gordon | Nationals | 9,088 | 46.6 |
Most of the vote was won by Liberal, Nationals and Greens, and the patterns of this vote is quite interesting, including the pattern of swings.
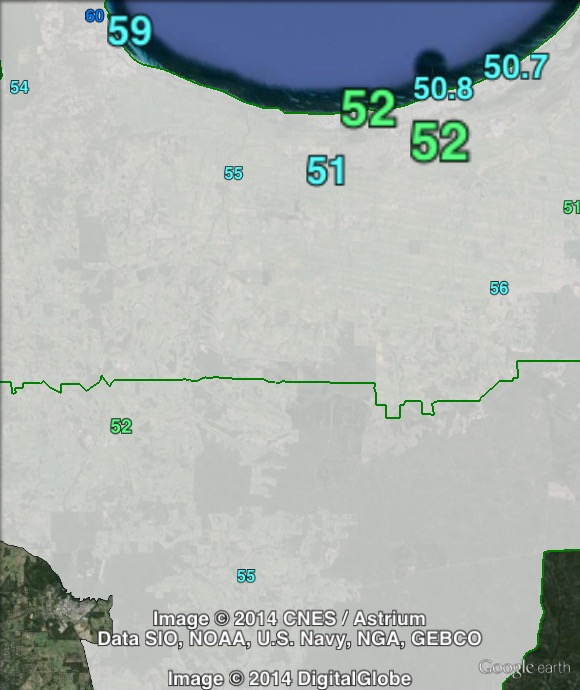
A majority of the vote in the electorate lies in the town of Busselton. The remaining rural booths were split between those in the Busselton council area (as “North”) and those in the Augusta-Margaret River council area (as “South”). I have split the booths into the same areas as I used for the by-election guide.
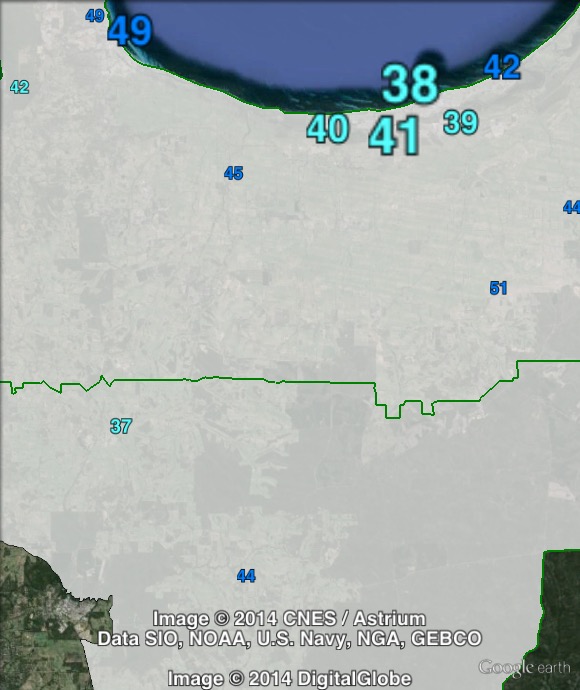
Interestingly, the Nationals vote was highest in Busselton, with 32.7%. The Greens outpolled the Nationals in rural booths overall, and outpolled the Nationals at six out of nine booths outside of the Busselton urban area.
The Liberal Party’s primary vote was highest with 45% in northern rural booths, with 40% in Busselton and 39.4% in the two booths in Augusta-Margaret River.
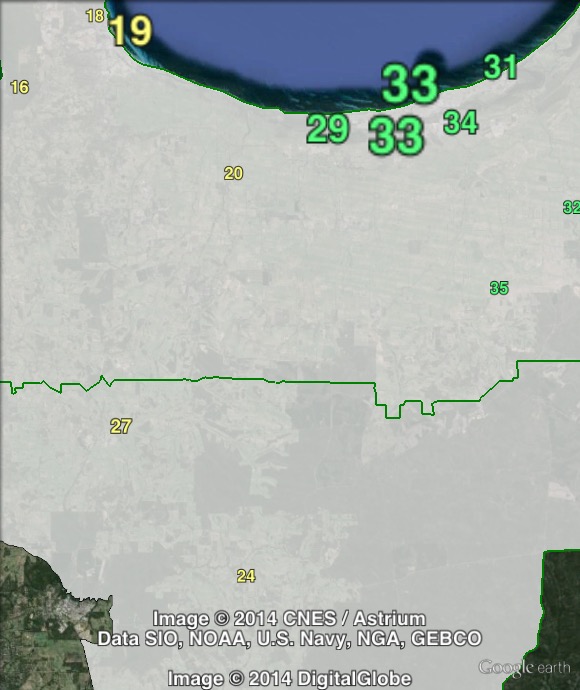
The Greens vote was highest in the two small booths at the southern end of the electorate, and then in the rural booths to the west of Busselton. There are six polling places in rural parts of Vasse where the Greens polled over 20%, but there are also two booths to the south-east of Busselton where the Greens polled less than 10%. The Greens vote in Busselton was 15.3%, and most booths were close to the average.
Looking at the Liberal/National two-candidate-preferred vote, the Liberal Party won the two-candidate-preferred vote in the northern and rural booths. They won seven out of nine booths outside of Busselton.
In Busselton, the Nationals won 51% of the two-candidate-preferred vote. The Nationals won the two larger booths, with the Liberal Party winning the two smaller booths. The Nationals margin of victory was larger in the booths where they won than in the Liberal booths, giving them a majority of the vote.
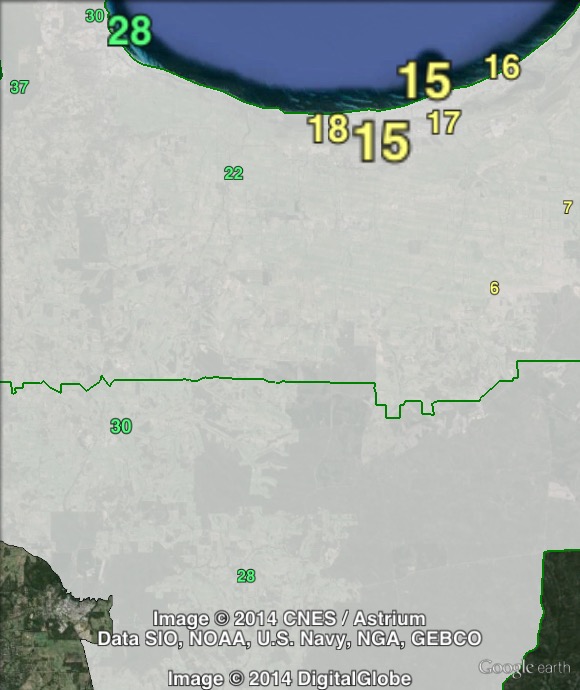
It’s also worth examining the swing against the Liberal Party on primary votes. The swing against the Liberal Party was much higher in Busselton and a number of booths to the south-east of Busselton.
| Voter group | GRN % | NAT % | LIB % | LIB 2PP | LIB swing | Total votes | % of votes |
| Busselton | 15.32 | 32.68 | 39.96 | 49.01 | -19.41 | 6952 | 46.65 |
| North | 23.39 | 23.37 | 44.90 | 55.18 | -11.18 | 5399 | 36.23 |
| South | 29.63 | 26.07 | 39.38 | 50.14 | -6.16 | 1097 | 7.36 |
| Other votes | 15.28 | 21.47 | 55.88 | 63.50 | -1.90 | 1453 | 9.75 |