ALP 12.4%
Incumbent MP
Hong Lim, since 1996.
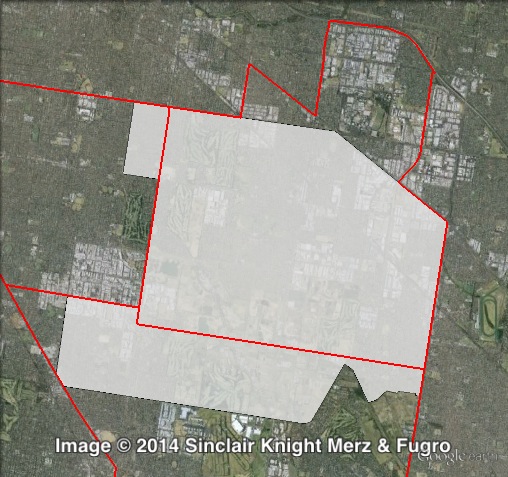
Geography
Southeastern Melbourne. Clarinda covers the suburbs of Clarinda, Clayton South, Heatherton and Oakleigh and parts of Bentleigh East, Cheltenham, Clayton, Springvale and Springvale South. Clarinda covers parts of four local government areas: Glen Eira, Greater Dandenong, Kingston and Monash, with a majority of the electorate in the City of Kingston.
Redistribution
Clarinda is a new name for the electorate of Clayton. Clayton/Clarinda shifted south, losing Clayton North and Huntingdale to Oakleigh, and gaining parts of a number of suburbs on its southern boundary from Mordialloc, and gaining a small area from Bentleigh. These changes cut the Labor margin from 15.3% to 12.4%.
History
Clarinda is a new name for the electorate previously named Clayton.
Clayton has existed since the 1985 election, and it has always been won by the ALP.
Gerard Vaughan won the seat in 1985, he had previously held the seat of Glenhuntly since 1979. Vaughan held the seat until 1996.
In 1996, Clayton was won by Hong Lim, also of the ALP. He has been re-elected in 1999, 2002, 2006 and 2010.
Candidates
- James Talbot-Kamoen (Greens)
- Hong Lim (Labor)
- James Marinis (Independent)
- Gandhi Bevinakoppa (Liberal)
- Melanie Vassiliou (Rise Up Australia)
Assessment
Clarinda is a safe Labor seat.
2010 election result
| Candidate | Party | Votes | % | Swing | Redist |
| Hong Lim | Labor | 15,843 | 54.34 | -7.85 | 52.66 |
| Justin Scott | Liberal | 8,833 | 30.29 | +6.54 | 32.82 |
| Matthew Billman | Greens | 2,782 | 9.54 | +0.13 | 8.55 |
| Peter Bolling | Democratic Labor | 976 | 3.35 | +3.35 | 2.93 |
| Darren Reid | Family First | 723 | 2.48 | -0.90 | 2.21 |
| Sex Party | 0.47 | ||||
| Other independents | 0.36 |
2010 two-party-preferred result
| Candidate | Party | Votes | % | Swing | Redist |
| Hong Lim | Labor | 19,071 | 65.31 | -4.96 | 62.40 |
| Justin Scott | Liberal | 10,129 | 34.69 | +4.96 | 37.60 |
Booth breakdown
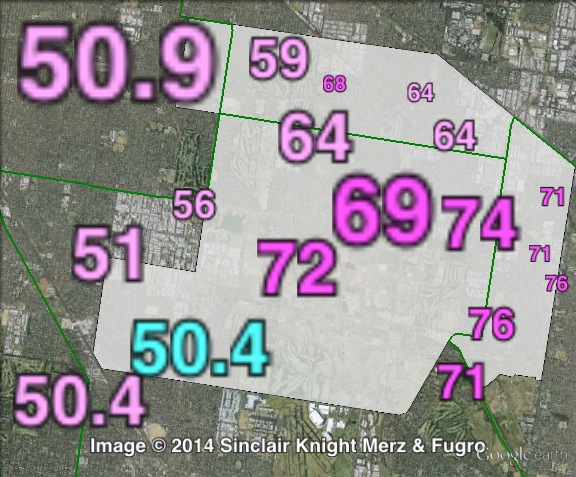
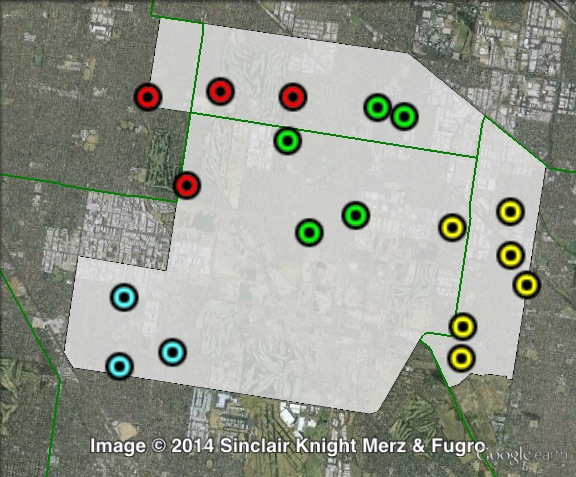
Booths in Clarinda have been divided into four parts: central, east, north-west and south-west.
The ALP won a majority of the two-party-preferred vote in all four areas, ranging from a slim 50.5 in the south-west to a massive 73.5% majority in the east.
The Greens came third, with a vote ranging from 7% in the east to 10.2% in the north-west.
| Voter group | GRN % | ALP 2PP % | Total | % of votes |
| Central | 7.77 | 67.33 | 9,078 | 24.02 |
| East | 7.03 | 73.51 | 6,881 | 18.21 |
| North-West | 10.23 | 55.00 | 6,638 | 17.57 |
| South-West | 8.36 | 50.48 | 6,580 | 17.41 |
| Other votes | 9.43 | 64.29 | 8,611 | 22.79 |