ALP 12.7%
Incumbent MP
Susan Close, since 2012.
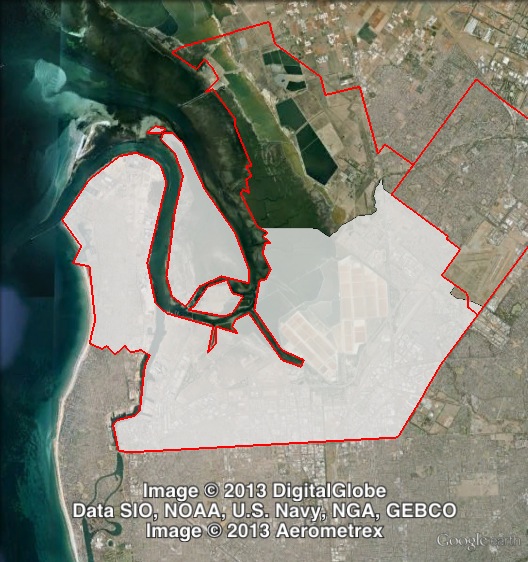
Geography
Northern Adelaide. The electorate covers the suburbs of Cavan, Dry Creek, Gillman, Green Fields, Largs North, Mawson Lakes, North Haven, Osborne, Ottoway, Outer Harbor, Taperoo, Wingfield and parts of Gepps Cross, Globe Derby Park, Largs Bay, Parafield Gardens, Peterhead, Pooraka and Rosewater. The electorate covers parts of Port Adelaide Enfield and Salisbury council areas.
Redistribution
Port Adelaide lost areas at the northern end of the electorate, including Bolivar and St Kilda, to Taylor. The redistribution reduced the ALP’s margin from 12.8% to 12.7%.
History
The name ‘Port Adelaide’ has been used by three incarnations of an electorate in the area. The first was a two-member electorate that existed from 1857 to 1887. The second was a Labor seat from 1938 until 1970.
The current electorate has existed since 2002, replacing the electorate of Hart that existed from 1993 to 2002. The seat has been held by two successive Labor MPs.
Hart was won in 1993 by Kevin Foley. Foley was re-elected in Hart in 1997, and in 2002 moved to Port Adelaide.
Foley was elected deputy leader of the ALP after the 2002 election, and thus became Deputy Premier in the Rann government.
Foley served as Deputy Premier and Treasurer until early 2011, when he stepped down from those roles. He resigned from Cabinet entirely in October 2011, and then resigned from Parliament in December 2011.
The February 2012 Port Adelaide by-election was contested by the ALP’s Susan Close. Without a Liberal candidate in the race, her main opposition came from independent Gary Johanson, who managed 47.1% of the two-candidate-preferred vote.
Candidates
Sitting Labor MP Susan Close is running for re-election. The Liberal Party is running Brad Vermeer. The Greens are running Mark Seater. Family First are running Bruce Hambour.
- Brad Vermeer (Liberal)
- Mark Seater (Greens)
- Bruce Hambour (Family First)
- Susan Close (Labor)
Assessment
Port Adelaide is a safe Labor seat. While Johanson was a threat at the by-election, he has shifted to the neighbouring seat of Lee, and it’s unlikely another serious candidate could emerge.
2010 result
| Candidate | Party | Votes | % | Swing |
| Kevin Foley | ALP | 10,854 | 49.9 | -14.4 |
| Sue Lawrie | LIB | 5,831 | 26.8 | +8.6 |
| Max James | IND | 2,398 | 11.0 | +11.0 |
| Marie Boland | GRN | 1,368 | 6.3 | +0.1 |
| Bruce Hambour | FF | 1,281 | 5.9 | -0.1 |
2010 two-party-preferred result
| Candidate | Party | Votes | % | Swing |
| Kevin Foley | ALP | 13,643 | 62.8 | -13.4 |
| Sue Lawrie | LIB | 8,089 | 37.2 | +13.4 |
2012 by-election result
| Candidate | Party | Votes | % | Swing |
| Susan Close | ALP | 8,218 | 42.3 | -7.6 |
| Gary Johanson | IND | 4,717 | 24.3 | +24.3 |
| Sue Lawrie | IND | 2,938 | 15.1 | +15.1 |
| Stephen Humble | LDP | 1,415 | 7.3 | +7.3 |
| Justin McArthur | GRN | 1,096 | 5.6 | -0.6 |
| Colin Thomas | IND | 314 | 1.6 | +1.6 |
| Bob Briton | IND | 292 | 1.5 | +1.5 |
| Grant Carlin | ON | 269 | 1.4 | +1.4 |
| Elizabeth Pistor | DLP | 151 | 0.8 | +0.8 |
2012 by-election two-candidate-preferred result
| Candidate | Party | Votes | % | Swing |
| Susan Close | ALP | 10,277 | 52.9 | |
| Gary Johanson | IND | 9,133 | 47.1 |
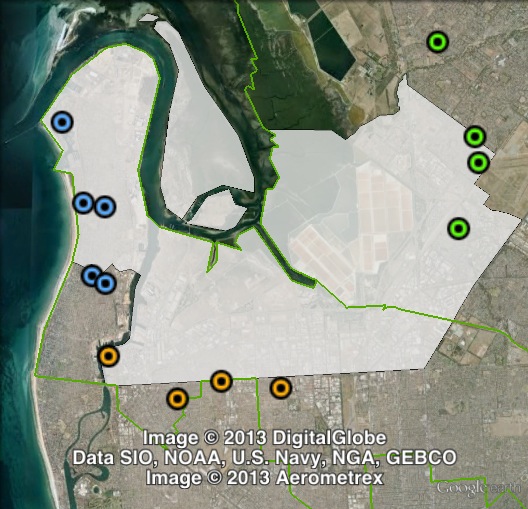
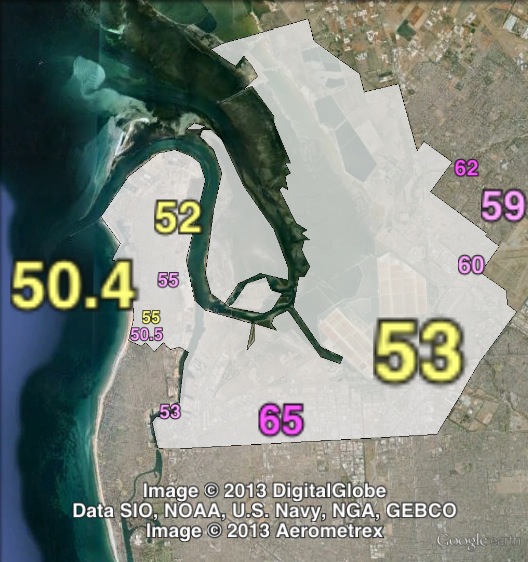
Booth breakdown
Booths have been divided into three areas: east, south and west. Polling places in Salisbury have been grouped as ‘east’. Those in Port Adelaide Enfield council area have been divided between those along the southern edge of the electorate as ‘south’ and those near the coast as ‘west’.
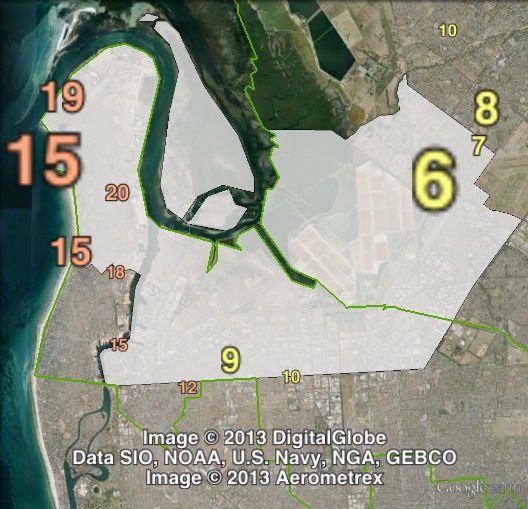
At the 2010 state election, the ALP won a majority in all three areas, ranging from 59.7% in the east to 65.3% in the west. Independent candidate Max James came third, with a vote ranging from 7% in the east to 16.8% in the west.
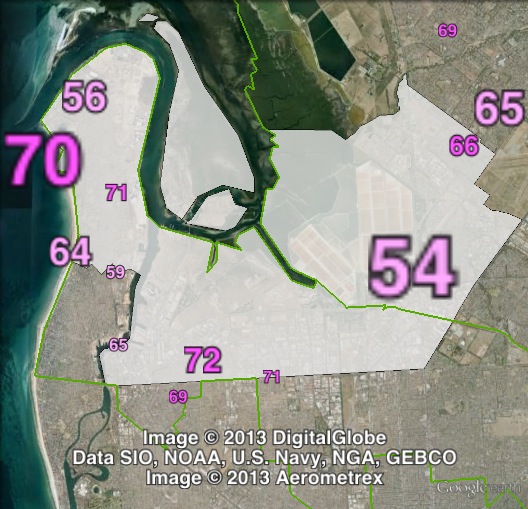
At the 2012 by-election, the ALP was competing with independent candidate Gary Johanson in the two-candidate-preferred vote. The ALP won a 53.8% majority in the east and 61.2% in the south. Johanson won a 50.6% majority in the west.
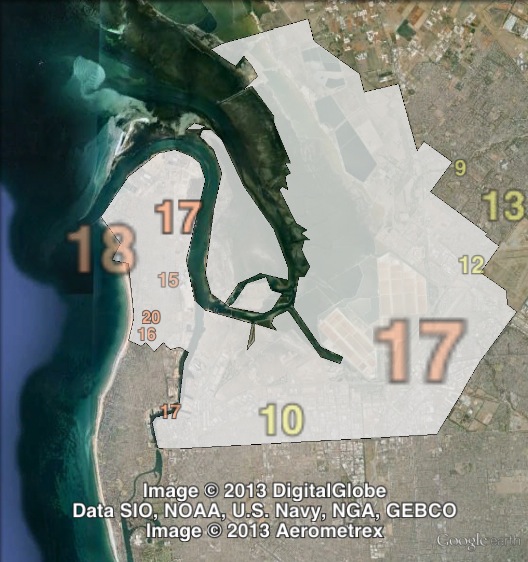
The third places candidate in the by-election was Sue Lawrie, who had run for the Liberal Party in 2010 and was now running as an independent. Her vote ranged from 11.9% in the south to 17.3% in the west.
2010 election breakdown
| Voter group | IND % | ALP 2PP % | Total votes | % of ordinary votes |
| West | 16.83 | 65.26 | 7,295 | 44.77 |
| East | 7.01 | 59.68 | 6,458 | 39.63 |
| South | 10.62 | 69.80 | 2,543 | 15.61 |
| Other votes | 8.29 | 59.39 | 4,728 | 0.00 |
2012 by-election breakdown
| Voter group | Lawrie % | ALP 2CP % | Total votes | % of votes |
| East | 14.32 | 53.84 | 6,975 | 35.94 |
| West | 17.31 | 49.39 | 6,593 | 32.97 |
| South | 11.87 | 61.23 | 2,502 | 12.89 |
| Other votes | 15.00 | 51.92 | 3,340 | 17.21 |
My prediction: Labor retain.