LNP 23.91%
Incumbent MP
Bruce Flegg, since 2004.
Geography
Western Brisbane. Moggill covers the suburbs of Kenmore, Chapel Hill, Brookfield, Pullenvale, Bellbowrie, Karana Downs and Mount Crosby.
History
The seat of Moggill has existed since 1986, and in that time the seat has always been held by the Liberal Party, and now the LNP.
The seat was first won in 1986 by Liberal MP Bill Lickiss. He had served as Member for Mount Coot-tha since 1963. He retired at the 1989 election.
David Watson won Moggill in 1989. Watson had held the federal seat of Forde for the Liberal Party from 1984 to 1987. He served as a minister in the coalition government from 1996 to 1998, and served as leader of the Liberal Party from 1998 to 2001.
Watson retired in 2004, and was succeeded by Bruce Flegg.
Flegg led the Liberal Party into the 2006 election, and served as Liberal leader until December 2007. He won re-election for the Liberal National Party in 2009, and again in 2012.
Candidates
Sitting Liberal National MP Bruce Flegg is not running for re-election. Flegg was originally blocked from running for preselection by the LNP executive, but that decision was rejected by local branch members, resulting in a preselection contest in which Flegg lost to Christian Rowan.
- Charles Worringham (Greens)
- Louisa Pink (Labor)
- Christian Rowan (Liberal National)
- Dion Van Zyl (Palmer United)
- Barry Searle (Independent)
Assessment
Moggill is a safe LNP seat.
2012 election result
| Candidate | Party | Votes | % | Swing |
| Bruce Flegg | Liberal National | 18,348 | 63.27 | +14.09 |
| Michael Nelson | Labor | 4,540 | 15.65 | -8.96 |
| Jake Schoermer | Greens | 4,001 | 13.80 | -0.15 |
| Barry Searle | Katter’s Australian | 2,112 | 7.28 | +7.28 |
2012 two-party-preferred result
| Candidate | Party | Votes | % | Swing |
| Bruce Flegg | Liberal National | 19,703 | 73.91 | +12.63 |
| Michael Nelson | Labor | 6,956 | 26.09 | -12.63 |
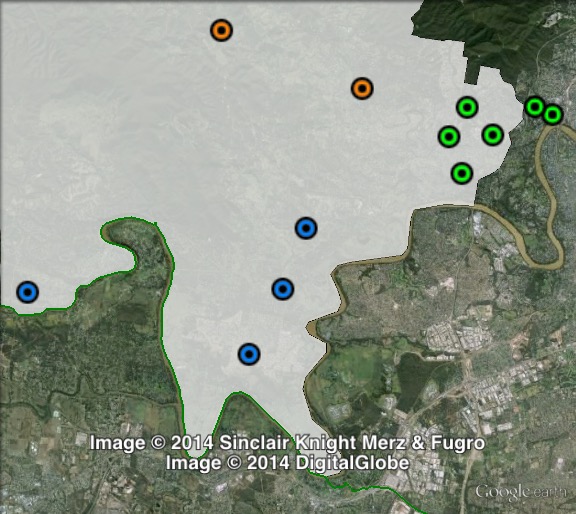
Booth breakdown
Booths in Moggill have been split into three parts. There is a cluster of booths close to Indooroopilly which have been grouped as “East”, and another group of booths along the Brisbane River grouped as “South”. The remaining two booths have been grouped as “Brookfield”.
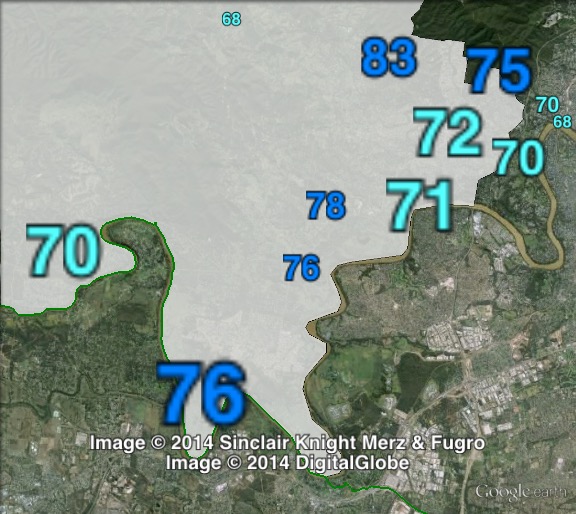
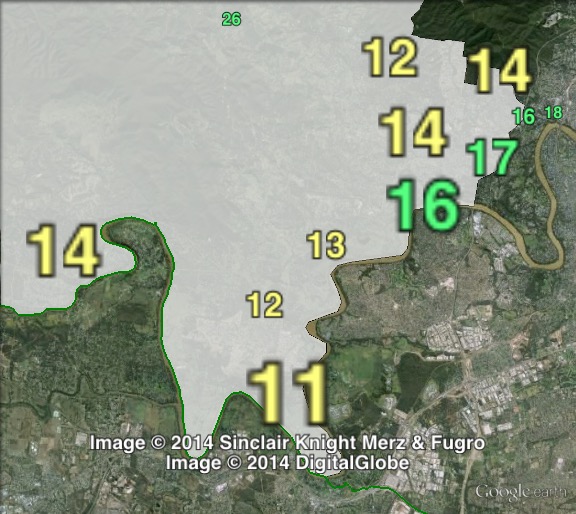
The LNP primary vote ranged from 61.5% in the east to 70.6% in Brookfield. On a two-party-preferred basis, the LNP vote ranged from 71.8% in the east to 80.9% in Brookfield.
The Labor vote ranged from 9.4% in Brookfield to 17.1% in the east. The Greens vote ranged from 12.2% in the south to 15.4% in the east.
The Electoral Commission does not publish two-party-preferred figures by polling place, so two-party-preferred figures in the following table and map are estimates.
| Voter group | LNP prim % | ALP prim % | GRN prim % | LNP 2PP % | Total | % of votes |
| East | 61.46 | 17.09 | 15.36 | 71.78 | 10,895 | 37.57 |
| South | 62.94 | 15.18 | 12.19 | 74.58 | 9,032 | 31.14 |
| Brookfield | 70.59 | 9.42 | 14.25 | 80.92 | 2,526 | 8.71 |
| Other votes | 63.90 | 16.33 | 13.23 | 73.81 | 6,548 | 22.58 |
LNP hold but does anyone sniff any sort of swing against the LNP here, greater than what turns out to be the uniform swing? A lot of people there apparently weren’t happy with how Flegg was treated.