LNP 13.15%
Incumbent MP
Tim Mander, since 2012.
Geography
Northern fringe of Brisbane. The seat straddles the border between the City of Brisbane and Moreton Bay Regional Council. A majority of the population lives in the City of Brisbane at the southern end of the seat, with a smaller number living in a larger geographic area in Moreton Bay LGA. The seat covers the suburbs of Oxford Park, Everton Hills, Albany Hill and parts of Mitchelton, Keperra and Arana Hills.
History
Everton has existed since the 1972 election. The ALP held the seat continuously from 1977 to 2012.
Gerry Jones won the seat for the ALP at the 1972 election. He lost the seat in a massive landslide to Joh Bjelke-Petersen’s National-Liberal government in 1974. Jones went on to serve in the Senate from 1980 to 1996.
In 1974 the seat was won by the Liberal Party’s Brian Lindsay. He served for one term before losing in 1977 to the Labor Party’s Glen Milliner.
Milliner held the seat from 1977 to 1992. Milliner became a minister in the Goss Labor government in 1989. In 1992 he moved to the new seat of Ferny Grove, and was succeeded by Rod Selford in Everton.
Selford had been first elected in the seat of Stafford in 1989 before moving to Everton in 1992. Welford joined the ministry when Peter Beattie became Premier in 1998. He served as a minister for eleven years, until he retired in 2009.
Welford was succeeded in 2009 by Murray Watt, who had previously served as Chief of Staff to Anna Bligh.
In 2012, Watt was defeated by LNP candidate Tim Mander.
Candidates
- Aidan Norrie (Greens)
- Jeff Frew (Labor)
- Tim Mander (Liberal National)
Assessment
Everton would normally be a marginal seat, leaning towards Labor. If there was a uniform swing to Labor across Queensland, Everton would be the seat that gives Labor a majority in the Legislative Assembly.
2012 election result
| Candidate | Party | Votes | % | Swing |
| Tim Mander | Liberal National | 16,364 | 57.50 | +13.38 |
| Murray Watt | Labor | 8,851 | 31.10 | -13.29 |
| Bruce Hallett | Greens | 2,053 | 7.21 | -1.86 |
| Denym Witherow | Katter’s Australian | 1,192 | 4.19 | +4.19 |
2012 two-party-preferred result
| Candidate | Party | Votes | % | Swing |
| Tim Mander | Liberal National | 17,125 | 63.15 | +14.54 |
| Murray Watt | Labor | 9,991 | 36.85 | -14.54 |
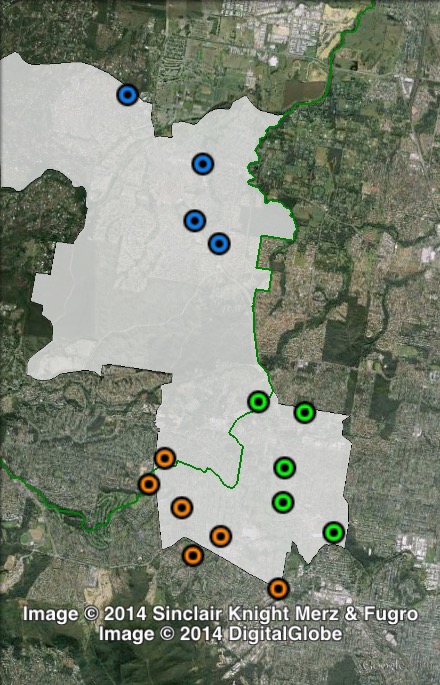
Booth breakdown
Booths in Everton have been divided into three parts: Albany Creek in the north, Everton Park in the south-east and Mitchelton in the south-west.
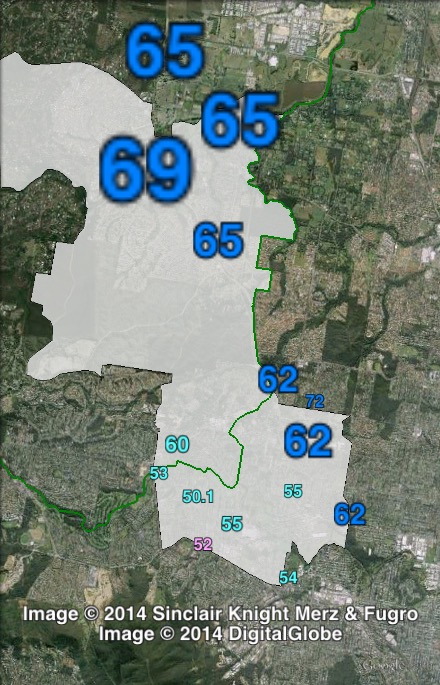
The LNP won all three areas, with an estimated two-party-preferred vote ranging from 54.5% in Mitchelton to 66.1% in Albany Creek.
The LNP’s primary vote ranged from 48.4% in Mitchelton to 61.5% in Albany Creek. Labor’s vote ranged from 29.6% in Albany Creek to 37.8% in Mitchelton.
The Electoral Commission does not publish two-party-preferred figures by polling place, so two-party-preferred figures in the following table and map are estimates.
| Voter group | LNP prim % | ALP prim % | LNP 2PP % | Total | % of votes |
| Albany Creek | 61.50 | 29.58 | 66.13 | 11,579 | 40.69 |
| Everton Park | 56.45 | 31.42 | 62.34 | 5,936 | 20.86 |
| Mitchelton | 48.38 | 37.79 | 54.47 | 3,694 | 12.98 |
| Other votes | 56.61 | 29.86 | 63.42 | 7,251 | 25.48 |
This seat will be interesting to watch. Labor recored 67% 2PP in 2001 and since then the margins been whittled down to a ridiculously large 9% swing in 09 and 14% last election. Whilst I think Mander has had a good profile the last 3 years and has been a strong candidate, a correction is bound to happen and I think this will swing above the state wide swing. Whether or not its enough to deliver the seat back to labor, I’m not sure at this stage I’d put the LNP marginally ahead
It will be close, but Tim Mander will hold given his current swing and good local presence.
My prediction: Tradtionally an ALP seat, the LNP could hold on here in 2015.