NAT 28.8%
Incumbent MP
Andrew Stoner, since 1999.
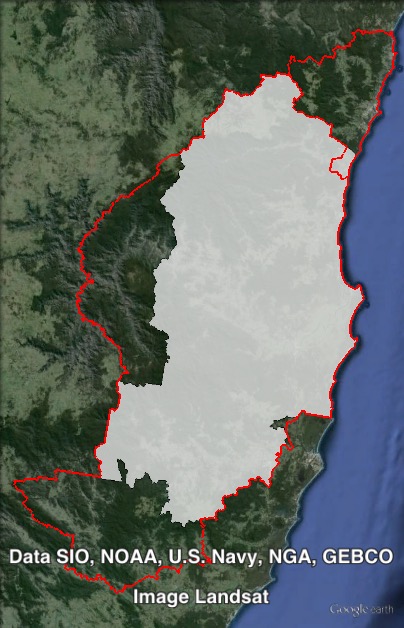
Geography
Mid-North Coast of NSW. Oxley covers all of Bellingen, Kempsey and Nambucca councils and parts of the Port Macquarie-Hastings council area. The main towns in the seat are Kempsey, Nambucca Heads, Wauchope and Bellingen.
Redistribution
Oxley underwent minor modifications. Those parts of the seat in Armidale-Dumaresq and Walcha councils were transferred to Northern Tablelands and Tamworth, and those parts of the seat in Greater Taree council area were transferred to Myall Lakes. The seat’s northern boundary with Coffs Harbour was aligned with the Bellingen-Coffs Harbour local government boundary.
History
The electoral district of Oxley has existed since 1920, with the exception of the 1988 election. It was a three-member district from 1920 to 1927, and since then has been a single-member district. It has been held by the Country/National Party continuously since 1965.
Independent candidate George Mitchell won the seat of Oxley in 1941, defeating the sitting United Australia Party MP in an election where the conservative government was swept aside, to be replaced by 24 years of Labor rule.
Mitchell spent much of the next term on active military service in the Second World War. At the 1944 election, the major parties did not stand official candidates against him, but an independent Country Party candidate, Les Jordan, defeated Mitchell, and then joined the Country Party caucus.
Jordan was re-elected five times for the Country Party, but after the 1959 election he switched from the Country Party to the Liberal Party. He was re-elected as a Liberal in 1962 and 1965, and died in office later in 1965.
The 1965 by-election was won by Bruce Cowan, also of the Country Party. He served as a minister from 1975 to 1976. In 1980 he resigned to run for the federal seat of Lyne, which he won in a three-cornered contest. He held the federal seat until his retirement in 1993.
Peter King won the 1981 Oxley by-election for the National Country Party. Later in the year, however, the redistribution abolished the neighbouring seat of Raleigh, and that seat’s MP, Jim Brown, challenged King for preselection in Oxley, and King retired.
Brown had held the seat of Raleigh since 1959. He held Oxley for one term, retiring in 1984.
Bruce Jeffery won Oxley for the National Party in 1984. The 1988 redistribution abolished the seat of Oxley, and created the seat of Port Macquarie. Jeffery contested and won the new seat. In 1991, Oxley was again restored, and Jeffery returned to his original seat, with the sitting Member for Manning moving to Port Macquarie.
Jeffery retired in 1999, when he was succeeded by Andrew Stoner. Stoner was elected National Party leader following the 2003 election.
Stoner became Deputy Premier after the Liberal-National Coalition won power in 2011, and served in a variety of ministerial portfolios in the new government. Stoner resigned as Deputy Premier and Nationals leader in October 2014.
Candidates
Sitting Nationals MP Andrew Stoner is not running for re-election, but sitting Nationals MLC Melinda Pavey will be running in Oxley.
- Melinda Pavey (Nationals)
- John Klose (Christian Democratic Party)
- Fran Armitage (Labor)
- Joe Costa (No Land Tax)
- Carol Vernon (Greens)
Assessment
Oxley is a safe Nationals seat.
2011 election result
| Candidate | Party | Votes | % | Swing | Redist |
| Andrew Stoner | Nationals | 29,412 | 66.9 | +7.8 | 66.8 |
| Jeremy Bradley | Greens | 5,506 | 12.5 | +1.8 | 12.4 |
| Joe Blackshield | Labor | 5,425 | 12.3 | -12.6 | 12.6 |
| Richard McGovern | Independent | 2,251 | 5.1 | +5.1 | 4.7 |
| John Klose | Christian Democrats | 779 | 1.8 | +1.8 | 1.8 |
| Marcus Aussie-Stone | Independent | 594 | 1.4 | +1.4 | 1.2 |
| Others | 0.5 |
2011 two-candidate-preferred result
| Candidate | Party | Votes | % |
| Andrew Stoner | Nationals | 30,994 | 78.8 |
| Jeremy Bradley | Greens | 8,358 | 21.2 |
2011 two-party-preferred result
| Candidate | Party | Votes | % | Swing | Redist |
| Andrew Stoner | Nationals | 30,851 | 79.1 | +13.2 | 78.8 |
| Joe Blackshield | Labor | 8,162 | 20.9 | -13.2 | 21.2 |
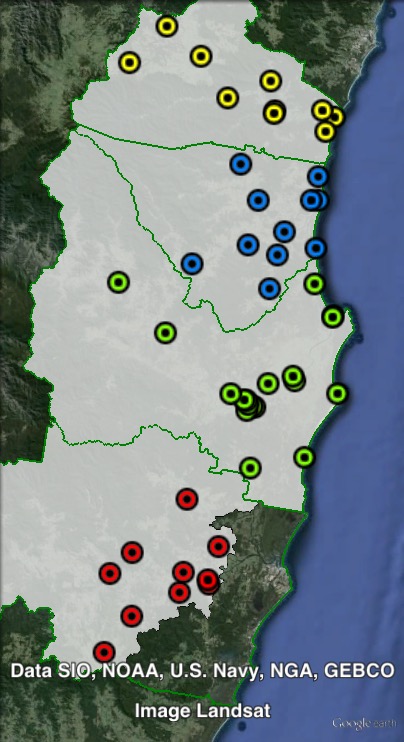
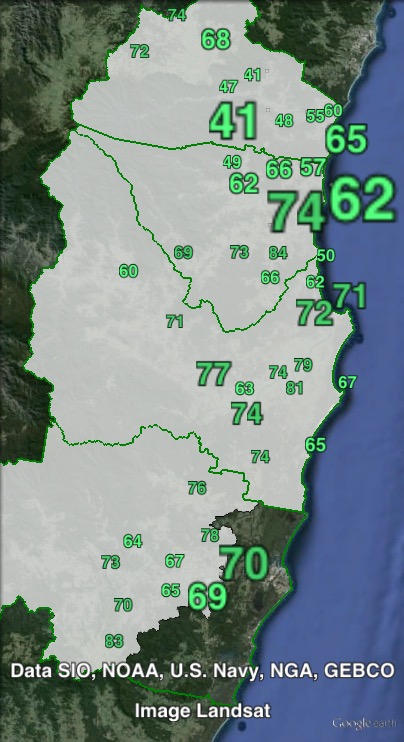
Booth breakdown
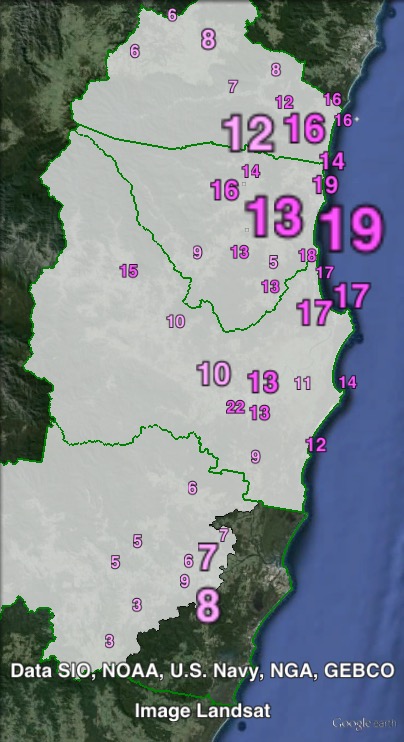
Booths in Oxley have been split into four parts, along local government boundaries. Polling places in the Bellingen, Kempsey and Nambucca council areas have been grouped together, while those booths in the Port Macquarie-Hastings council area have been grouped as “South”.
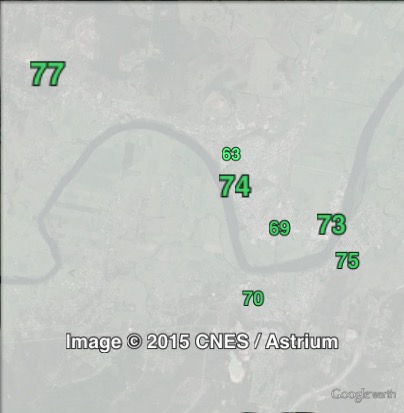
The Nationals won a solid majority of the primary vote in all four areas, ranging from 55% in Bellingen to 72% in Kempsey (although the Nationals were outpolled by the Greens in the town of Bellingen itself).
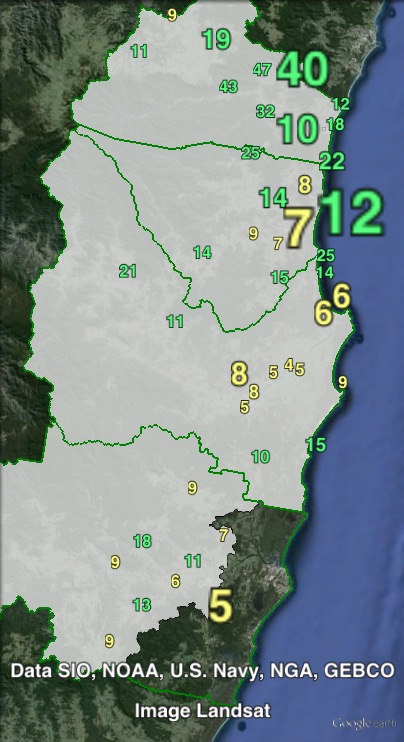
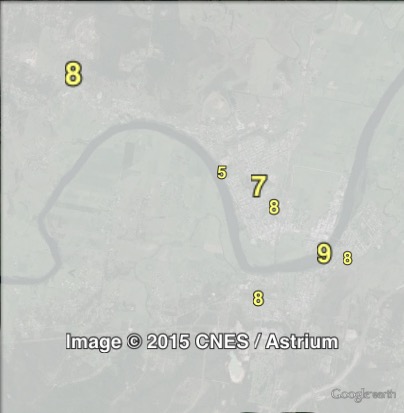
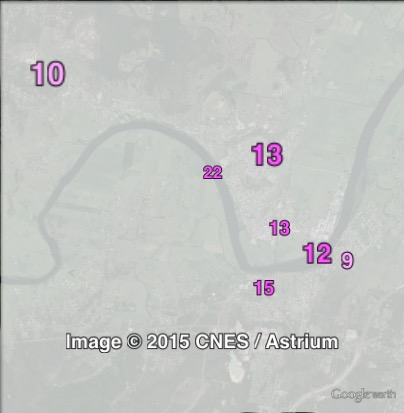
The Greens outpolled Labor in two out of four areas. The Greens vote ranged from 7% in the south to 25% in Bellingen. The Labor vote ranged from 7% in the south to 15.5% in Nambucca.
| Voter group | NAT % | GRN % | ALP % | Total | % of votes |
| Kempsey | 72.1 | 8.2 | 13.0 | 13,328 | 29.6 |
| Nambucca | 65.2 | 12.4 | 15.5 | 9,513 | 21.1 |
| Bellingen | 55.4 | 25.1 | 12.3 | 6,327 | 14.0 |
| South | 70.1 | 7.1 | 7.0 | 5,482 | 12.2 |
| Other votes | 66.8 | 12.7 | 12.6 | 10,436 | 23.1 |
Wow having the Elands booth removed from this seat has really hurt the Greens vote.
My prediction: Easy National hold.
Booths added in the north polled more votes than Elands and polled well in Federal 2013
I was just surprised that the notional Greens vote following the redistribution was 2.7% lower, but yes Carol I expect you’ll probably recover that difference from an increase in the booths that were previously in Coffs Harbour.
Actually I made an error with the calculations in this seat that made the Greens vote look a lot smaller. If you looked at the booth breakdown table (now fixed) the Greens vote for “other votes” was around 1.2%. Basically when I took the redistributed special votes and put them back with the ordinary votes I mislabelled the parties, so the CDP vote was over-estimated and the Greens vote underestimated.
Now I only estimate a 0.1% drop in the Greens vote. This is still enough to push the Greens into third. In 2011, the Greens outpolled Labor by 81 votes. On my model, Labor now outpolls the Greens by 122 votes. Antony estimates the gap is 126 votes in favour of Labor, so that sounds about right.
Thanks for finding the error – I might run a check on my other figures for any other weird patterns.
Oops I probably should’ve realised that might’ve been an error. The redistributed estimate here was Greens 12.3, Labor 12.6, virtually the same as your calculation, but I only remembered that now.
http://www.parliament.nsw.gov.au/prod/parlment/publications.nsf/key/2013NSWRedistribution:AnalysisofFinalElectoralBoundaries