NAT 27.1%
Incumbent MP
Andrew Gee, since 2011.
Geography
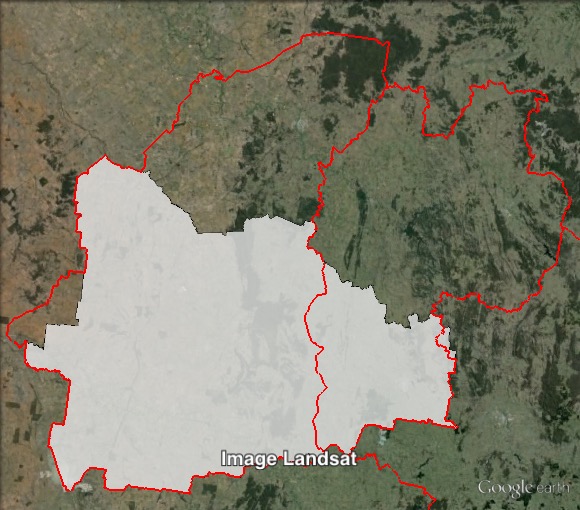
Central west NSW. Orange covers the entirety of the Orange, Cabonne, Forbes and Parkes council areas, with the main centres being in the cities of Orange, Forbes and Parkes.
Redistribution
Orange and the neighbouring seat of Dubbo were both realigned in the redistribution from a north-south axis to an east-west axis. Orange gained the western half of the seat, including Forbes and Parkes, from Dubbo in exchange for areas to the north of Orange, including Wellington and Mudgee, which became part of Dubbo. These changes increased the Nationals margin over Labor from 24.2% to 27.1%.
History
The seat of Orange has existed in the Legislative Assembly since 1859, with the exception of three elections in the 1920s. The seat was a single-member district up to 1880, then a two-member district from 1880 to 1894.
The seat has been a single-member district since 1894. The seat has been held by the Country/National Party since 1947.
Orange was held from 1941 to 1947 by the ALP’s Robert O’Halloran. He had been one of the members for the district of Eastern Suburbs from 1920 to 1927, but he fell out with Labor leader and Premier Jack Lang, and at the 1927 election he was denied preselection for any of the new single-member districts that replaced Eastern Suburbs.
He held Orange from 1941 to 1947, when he lost to the Country Party’s Charles Cutler.
Cutler was elected Country Party deputy leader in 1958 and leader in 1959. He held that role until his retirement in 1975. He also served as Deputy Premier in the Coalition government from 1965 to 1975.
Cutler’s retirement in 1975 caused a by-election in early 1976. The by-election was won by National Country Party candidate Garry West. He served as a minister in the Coalition government from 1988 to 1995. Following the government’s defeat, he resigned from Parliament in early 1996.
The 1996 by-election was won by Russell Turner, also of the National Party. Turner was re-elected in 1999, 2003 and 2007.
Turner retired in 2011, and the seat was won by Nationals candidate Andrew Gee.
Candidates
- Bernard Fitzsimon (Labor)
- Janelle Bicknell (Greens)
- Juan Fernandez (No Land Tax)
- John Gilbert (Christian Democratic Party)
- Andrew Gee (Nationals)
Assessment
Orange is a safe Nationals seat.
2011 election result
| Candidate | Party | Votes | % | Swing | Redist |
| Andrew Gee | Nationals | 25,656 | 56.7 | +6.1 | 57.1 |
| John Davis | Independent | 7,261 | 16.0 | -7.6 | 9.3 |
| Kevin Duffy | Labor | 6,818 | 15.1 | -5.5 | 11.9 |
| Fiona Rossiter | Family First | 3,014 | 6.7 | +6.7 | 4.4 |
| Stephen Nugent | Greens | 2,538 | 5.6 | +0.3 | 4.4 |
| Others | 12.9 |
2011 two-candidate-preferred result
| Candidate | Party | Votes | % | Swing | Redist |
| Andrew Gee | Nationals | 28,288 | 71.9 | +10.2 | 67.9 |
| John Davis | Independent | 11,054 | 28.1 | -10.2 | 32.1 |
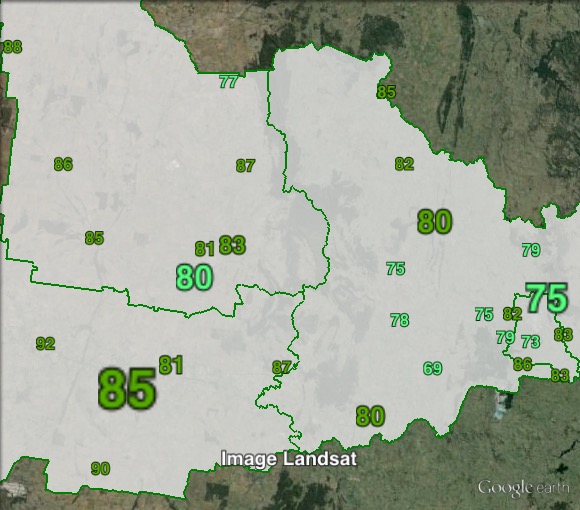
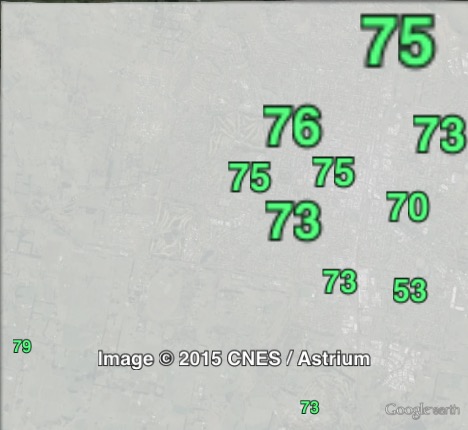
2011 two-party-preferred result
| Candidate | Party | Votes | % | Swing | Redist |
| Andrew Gee | Nationals | 28,664 | 74.2 | +7.1 | 77.1 |
| Kevin Duffy | Labor | 9,953 | 25.8 | -7.1 | 22.9 |
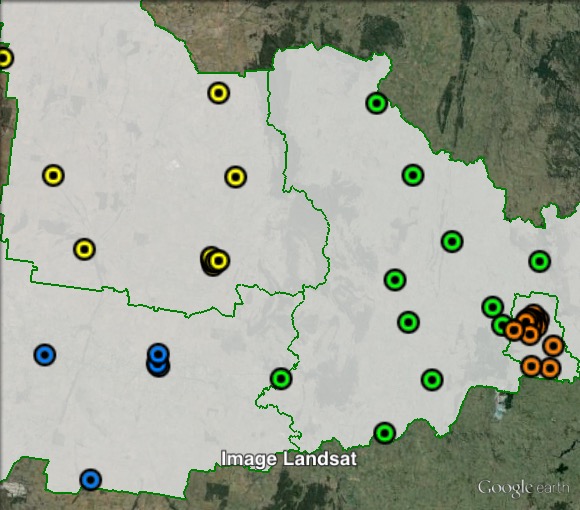
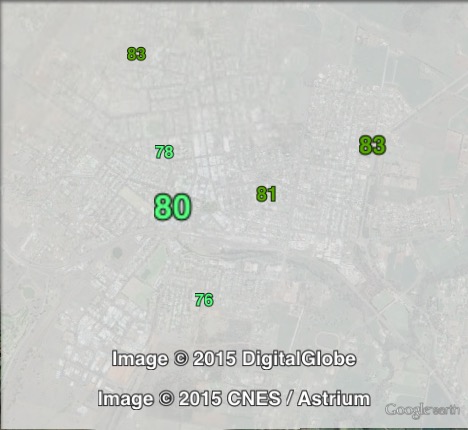
Booth breakdown
Booths in Orange have been split into four parts, along the lines of the four local government areas: Cabonne, Forbes, Orange and Parkes. Forbes and Parkes were entirely contained in Dubbo before the redistribution, along with a small part of Cabonne. Most of Cabonne and all of Orange were already in Orange before the election.
The Nationals won a majority of the primary vote in all four areas, ranging from 52% in Parkes to 65% in Cabonne.
The vote for key independents ranged from 16% in Orange and Cabonne to 39% in Parkes. This includes votes for John Davis in Orange and Dawn Fardell in Dubbo. The vote was much higher for Fardell than for Davis.
The Labor vote ranged from 7% in Parkes and Forbes to 15% in Orange.
| Voter group | NAT % | IND % | ALP % | Total | % of votes |
| Orange | 55.1 | 16.1 | 15.3 | 17,650 | 37.8 |
| Parkes | 52.1 | 39.3 | 6.7 | 6,596 | 14.1 |
| Cabonne | 64.7 | 15.8 | 11.8 | 5,618 | 12.0 |
| Forbes | 63.5 | 27.8 | 6.8 | 4,323 | 9.3 |
| Other votes | 57.0 | 22.7 | 11.6 | 12,449 | 26.7 |
My prediction: Easy National hold.