LIB 12.4%
Incumbent MP
Tanya Davies, since 2011.
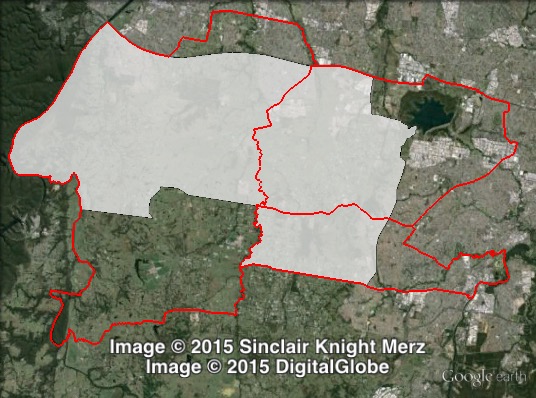
Geography
Western Sydney. Mulgoa includes southern parts of the City of Penrith, and small parts of the Blacktown, Fairfield and Liverpool council areas. Suburbs include St Clair, Glenmore Park, Mulgoa, Wallacia, Erskine Park, Kemps Creek and Cecil Hills.
Redistribution
Mulgoa lost St Marys to Londonderry and Badgerys Creek and Bringelly to Camden, and made up for these changes by expanding east to take in Erskine Park, Kemps Creek and Cecil Park from Liverpool and Smithfield. These changes slightly increased the Liberal margin from 12% to 12.4%.
History
Mulgoa was first created as an electoral district in 1988. It was won in 1988 by the ALP’s Tony Aquilina. In 1991, the seat of Mulgoa was abolished, with parts of it shifting to the new seats of St Marys and Badgerys Creek. Aquilina moved to the seat of St Marys. In Badgerys Creek, the sitting Liberal Member for Minchinbury, Anne Cohen, defeated the ALP’s Diane Beamer.
In 1995, Aquilina retired on pressure from the Labor leadership over scandals. He later spent a year in prison after being convicted of various offences. St Marys was won by Jim Anderson of the ALP, who moved to Londonderry in 1999 when St Marys was abolished and held it until his death in 2003.
In Badgerys Creek, Beamer defeated Cohen on a second attempt. In 1999, Badgerys Creek was abolished, and largely replaced by the restored seat of Mulgoa. Beamer was re-elected in Badgerys Creek in 1999, 2003 and 2007. She served as a minister in the Labor government from 2003 to 2007.
Diane Beamer retired in 2011, and Liberal candidate Tanya Davies won Mulgoa with a 23.2% swing.
Candidates
- Todd Carney (Labor)
- Jennifer Scholfield (Christian Democratic Party)
- Kingsley Liu (Greens)
- Tanya Davies (Liberal)
- Tania Canto (No Land Tax)
Assessment
Labor needs to win seats like Mulgoa to form government – it seems unlikely that they will achieve enough of a swing to win Mulgoa.
2011 election result
| Candidate | Party | Votes | % | Swing | Redist |
| Tanya Davies | Liberal | 23,822 | 53.2 | +17.9 | 53.4 |
| Prue Guillaume | Labor | 14,270 | 31.9 | -23.1 | 31.5 |
| Patrick Darley-Jones | Greens | 2,554 | 5.7 | +0.8 | 5.8 |
| Tony Robinson | Independent | 1,861 | 4.2 | +4.2 | 2.4 |
| Luke Portelli | Christian Democrats | 1,681 | 3.8 | +3.8 | 4.7 |
| Emily Dunn | Democratic Labour | 609 | 1.4 | +1.4 | 1.0 |
| Others | 1.2 |
2011 two-party-preferred result
| Candidate | Party | Votes | % | Swing | Redist |
| Tanya Davies | Liberal | 25,223 | 62.0 | +23.2 | 62.4 |
| Prue Guillaume | Labor | 15,437 | 38.0 | -23.2 | 37.6 |
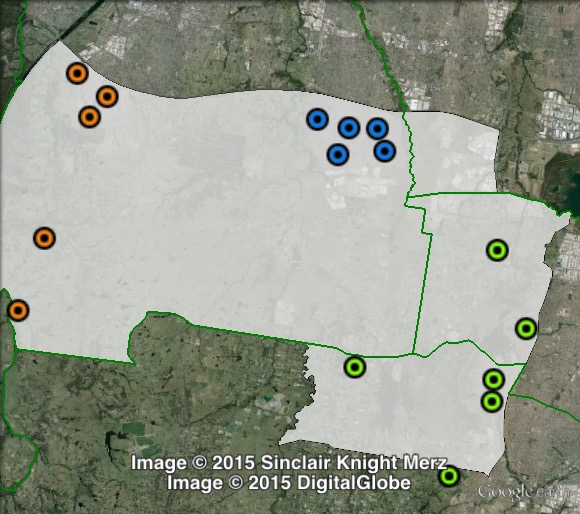
Booth breakdown
Booths in Mulgoa were split into three areas: central, east and west. “East” covers all of those polling places in the Liverpool and Fairfield council areas, while “Central” covers those clustered around St Clair and “West” covers those near the Nepean River.
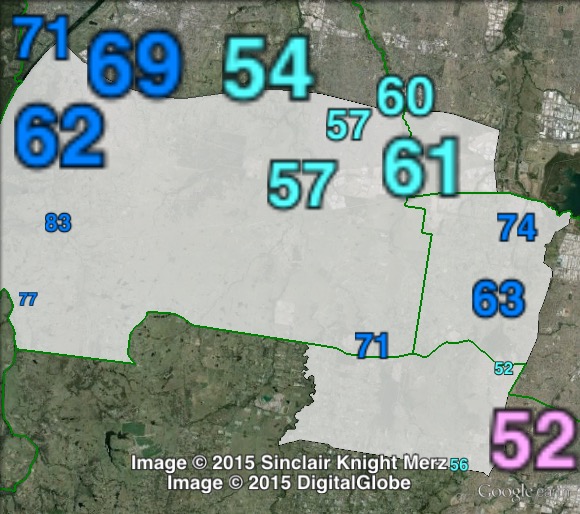
The Liberal Party’s two-party-preferred vote ranged from 57.6% in the centre to 68.8% in the west.
| Voter group | LIB 2PP % | GRN % | CDP % | Total votes | % of votes |
| Central | 57.6 | 6.8 | 4.2 | 13,212 | 30.9 |
| West | 68.8 | 4.5 | 3.5 | 11,098 | 26.0 |
| East | 60.3 | 4.9 | 7.0 | 8,932 | 20.9 |
| Other votes | 63.0 | 7.0 | 4.8 | 9,462 | 22.2 |
That’s a….very unfortunate name for the ALP candidate.
Haha, but think of the campaign opportunities (and name recognition!).
“Hi, I’m Todd Carney. No, not that Todd Carney.”
Another one I’m not calling until the day before.
It would be a lot easier to locate the local polling place if the map hadnt been obliterated in white!
Ermine, this link is probably a better bet for finding your local polling place.
http://map.elections.nsw.gov.au/Map.aspx?mode=PP&ID=SG1501-055
My prediction: Will likely stay with the Baird Government.