IND 14.6% vs LIB
Incumbent MP
Greg Piper, since 2007.
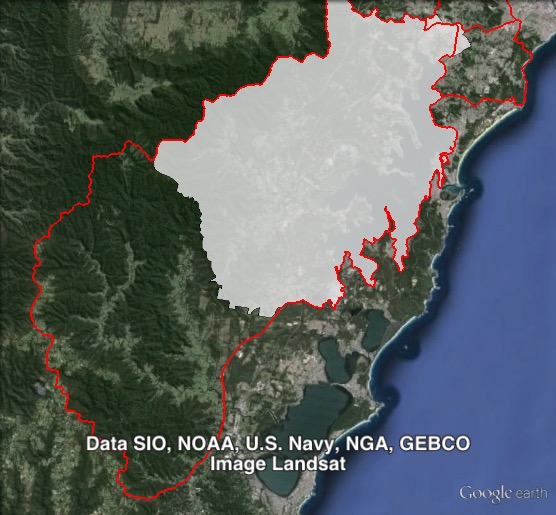
Geography
Hunter. Lake Macquarie covers those parts of the City of Lake Macquarie on the west side of Lake Macquarie itself, as well as parts of the City to the north of the lake. The seat covers Cardiff, Morriset, Toronto and Fassifern.
Redistribution
Lake Macquarie lost rural parts of Wyong Shire to Wyong, and gained Cardiff and Cardiff South from Charlestown, and gained Argenton from Wallsend.
History
The electoral district of Lake Macquarie has existed since 1950. The seat was held by the ALP from 1950 until the 2007 election.
Jim Simpson won the seat in 1950. He served as a minister in the Labor government from 1956 until the government lost power in 1965. He held the seat until his death in 1968.
The 1969 by-election was won by Lake Macquarie Shire President Merv Hunter. He held the seat until his retirement in 1991. He was succeeded by his son Jeff Hunter. He won re-election in 1995, 1999 and 2003.
In 2007, Hunter was defeated by independent Lake Macquarie Mayor Greg Piper by 106 votes
Candidates
- Ivan Macfadyen (Greens)
- Greg Piper (Independent)
- Daniel Collard (Liberal)
- Melissa Cleary (Labor)
- Kim Gritten (Christian Democratic Party)
- Andrew Coroneo (No Land Tax)
- Susan Strain (Animal Justice Party)
Assessment
Greg Piper holds Lake Macquarie by a reasonably large margin, and shouldn’t have any trouble winning a third term in 2015.
2011 election result
| Candidate | Party | Votes | % | Swing | Redist |
| Greg Piper | Independent | 19,678 | 43.7 | +13.4 | 41.3 |
| John McDonald | Liberal | 12,644 | 28.1 | +8.6 | 27.5 |
| Marcus Mariani | Labor | 8,385 | 18.6 | -21.9 | 20.5 |
| Charmian Eckersley | Greens | 3,094 | 6.9 | +1.1 | 6.6 |
| Kim Gritten | Christian Democrats | 1,269 | 2.8 | +0.7 | 2.8 |
| Others | 1.3 |
2011 two-candidate-preferred result
| Candidate | Party | Votes | % | Redist |
| Greg Piper | Independent | 25,356 | 64.9 | 64.6 |
| John McDonald | Liberal | 13,733 | 35.1 | 35.4 |
2011 two-party-preferred result
| Candidate | Party | Votes | % | Swing | Redist |
| John McDonald | Liberal | 18,147 | 59.4 | +24.4 | 57.4 |
| Marcus Mariani | Labor | 12,414 | 40.6 | -24.4 | 42.6 |
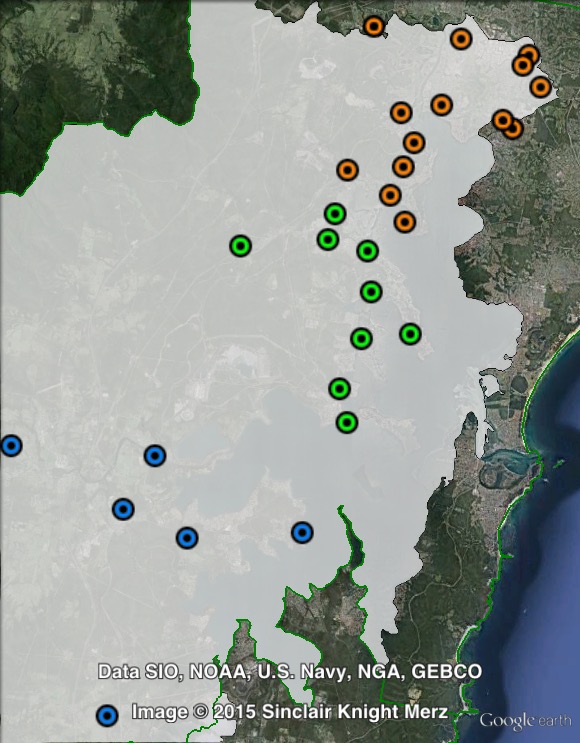
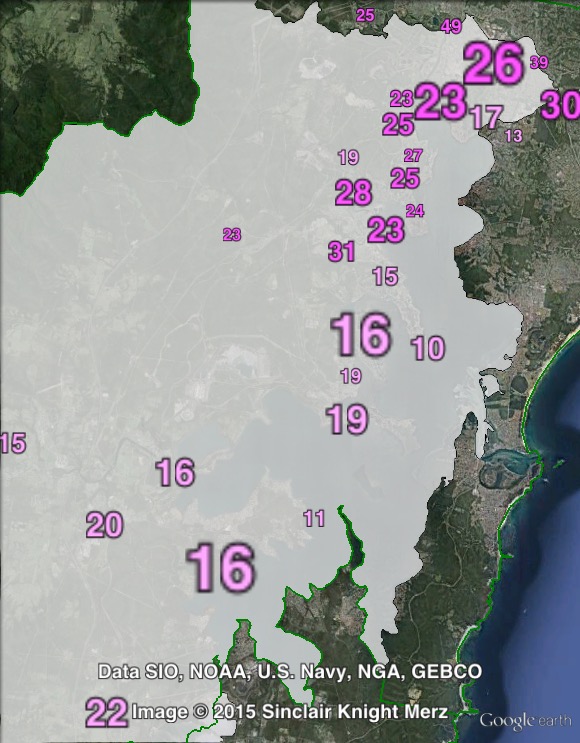
Booth breakdown
Booths in Lake Macquarie have been split into three parts: central, north and south.
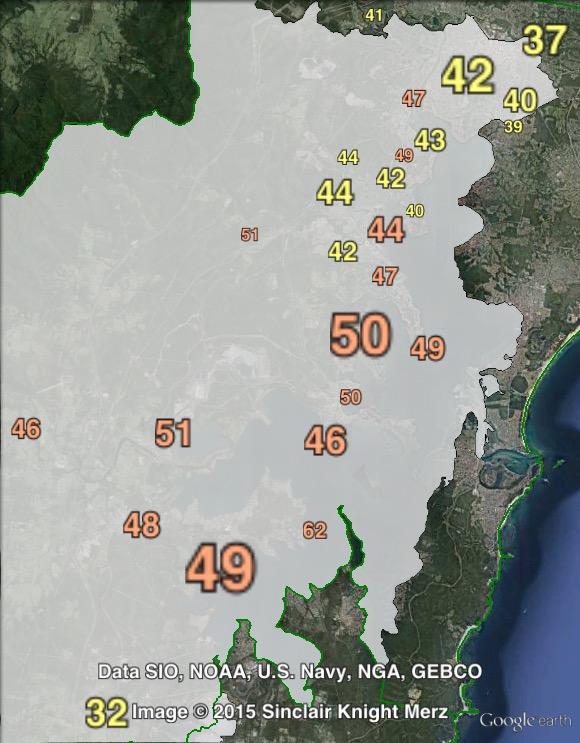
Independent MP Greg Piper topped the primary vote in all three areas. Piper’s vote was much lower at 32% in the north, compared to 47% in the centre and the south.
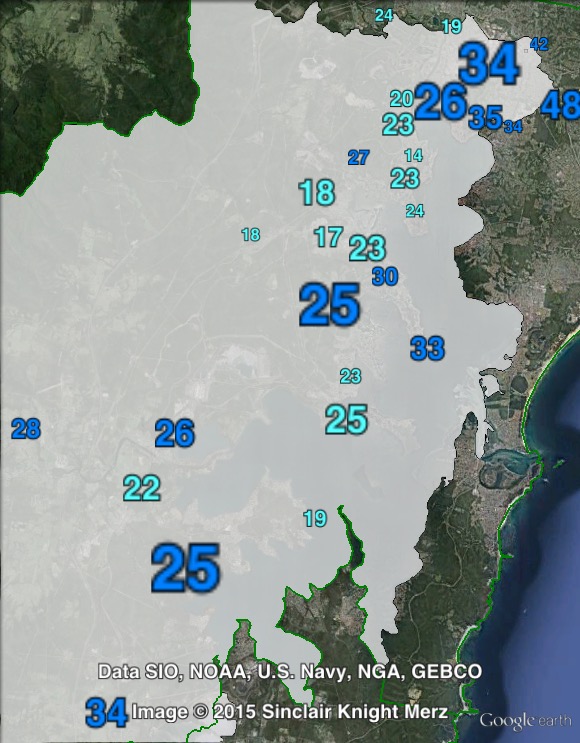
The Liberal vote ranged from 24% in the centre to 29% in the north.
The Labor vote ranged from 17.3% in the south to 25.5% in the north.
| Voter group | IND % | LIB % | ALP % | Total votes | % of votes |
| North | 32.3 | 29.2 | 25.5 | 14,164 | 30.8 |
| Central | 46.8 | 24.1 | 19.7 | 11,235 | 24.5 |
| South | 47.2 | 26.1 | 17.3 | 9,066 | 19.7 |
| Other votes | 42.3 | 29.8 | 17.6 | 11,465 | 25.0 |
My prediction: Greg Piper will easily win again, and Labor to come second.
My father, aged 92, lives in that electorate. When I rang him today he know that Greg Piper was the MP without me telling him. That is more than one can say for some younger constituents who have no Idea who their NSW MP is.