LIB 24.8%
Incumbent MP
Mark Speakman, since 2011.
Geography
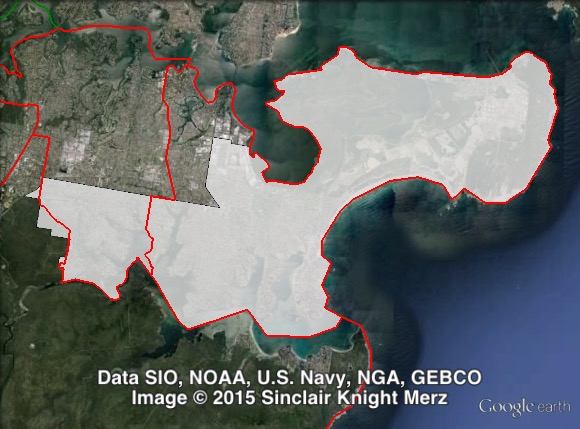
Southern Sydney. Cronulla covers parts of Sutherland Shire, including the suburbs of Burraneer, Caringbah, Cronulla, Grays Point, Gymea Bay, Kurnell, Lilli Pilli, Port Hacking, Woolooware and Yowie Bay.
Redistribution
Cronulla and the neighbouring seat of Miranda were realigned from north-south to east-west. Cronulla lost Sylvania Waters and Taren Point to Miranda, in exchange for Grays Point and Gymea Bay. These changes cut the Liberal margin from 25.5% to 24.8%.
History
The district of Cronulla has existed since 1959. In that time, it has been won by the Liberal Party at all but two elections.
Cronulla was first won in 1959 by Liberal MP Ian Griffith. He had won the seat of Sutherland in 1956, and moved to the new seat of Cronulla after the redistribution shifted Sutherland into Labor areas.
Griffith served as a minister from 1972 to 1975, and again for the final few months of the Coalition government in 1976. Griffith lost Liberal preselection in 1978 and retired.
The ALP’s Michael Egan won Cronulla in 1978. He was re-elected in 1981, but lost in 1984. Egan was elected to the Legislative Council in 1986. He became Treasurer when the ALP won power in 1995, serving in the role until his retirement in 2005.
Egan was defeated in 1984 by Liberal candidate Malcolm Kerr. Kerr was re-elected in 1988, 1991, 1995, 1999, 2003 and 2007.
In 2011, Kerr retired and was succeeded by Mark Speakman.
Candidates
- Mark Speakman (Liberal)
- Peter Scaysbrook (Labor)
- Nathan Hunt (Greens)
- Christie Mortimer (No Land Tax)
- George Capsis (Christian Democratic Party)
Assessment
Cronulla is a safe Liberal seat.
2011 election result
| Candidate | Party | Votes | % | Swing | Redist |
| Mark Speakman | Liberal | 29,845 | 66.1 | +9.4 | 65.2 |
| Stefanie Jones | Labor | 8,653 | 19.2 | -6.9 | 19.5 |
| Josh Peacock | Greens | 3,681 | 8.1 | +1.3 | 8.7 |
| Beth Smith | Christian Democrats | 1,571 | 3.5 | -1.1 | 3.3 |
| Patricia Poulos | Independent | 1,424 | 3.2 | +3.2 | 2.4 |
| Others | 1.0 |
2011 two-party-preferred result
| Candidate | Party | Votes | % | Swing | Redist |
| Mark Speakman | Liberal | 31,382 | 75.5 | +8.1 | 74.8 |
| Stefanie Jones | Labor | 10,157 | 24.5 | -8.1 | 25.2 |
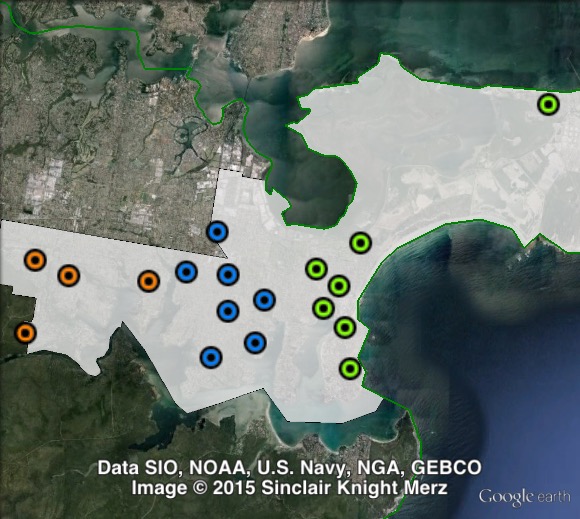
Booth breakdown
Booths in Cronulla have been split into three parts: central, east or west.
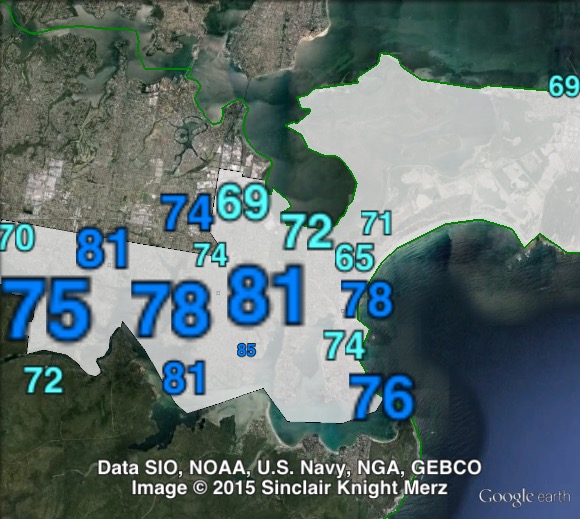
The Liberal Party’s two-party-preferred vote (over Labor) ranged from 72.7% in the east to 77.2% in the centre.
| Voter group | LIB 2PP % | GRN % | Total votes | % of votes |
| Central | 77.2 | 7.4 | 13,732 | 28.8 |
| East | 72.7 | 9.7 | 11,893 | 25.0 |
| West | 75.2 | 8.6 | 8,597 | 18.1 |
| Other votes | 74.2 | 9.2 | 13,401 | 28.1 |
My prediction: Liberal hold.
@ Anton Kreitzer Mark Speakman is a very hard working local member. I’m obviously not certain but maybe a swing of around 4-5% but highly likely to be in between the 07 margin of Kerr and now.