LIB 2.8%
Incumbent MP
David Coleman, since 2013.
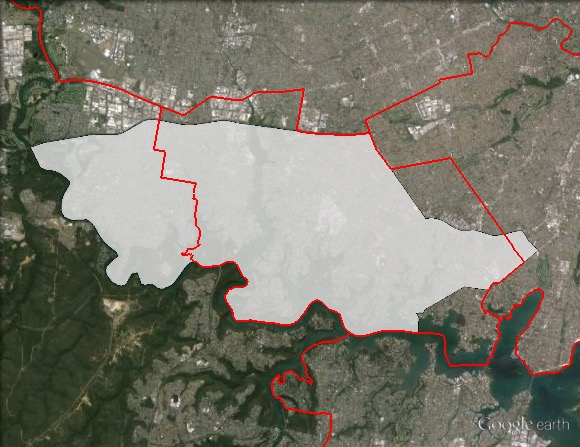
Geography
Southern Sydney. Banks covers large parts of the St George area and neighbouring suburbs. It includes most of Hurstville council area, a majority of Kogarah council area and parts of Bankstown and Canterbury council areas. Key suburbs include East Hills, Panania, Padstow, Picnic Point, Revesby, Mortdale, Peakhurst, Penshurst, Allawah and Oatley.
Redistribution
Banks expanded west, gaining East Hills, Panania, Picnic Point and Revesby from Hughes. Banks lost Blakehurst to Cook, lost Hurstville to Barton and lost areas north of the M5 to Watson and Barton. These changes increased the Liberal margin in Banks from 1.8% to 2.8%.
History
Banks was created for the 1949 election, and was held by Labor continuously until 2013.
The seat was first won in 1949 by Labor candidate Dominic Costa. Costa held the seat for twenty years, always as a member of the opposition, retiring in 1969.
Vince Martin was elected in 1969, and held the seat until he was defeated for preselection in 1980 by John Mountford. Mountford held the seat until his retirement in 1990.
In 1990, Banks was won by Labor candidate Daryl Melham. Melham held the seat for over two decades, serving in the Opposition shadow ministry from 1996 to 1998 and again from 2001 to 2004. Successive swings against the ALP wore his margin down to 1.06% in 2004, although a favourable redistribution before the 2007 election, combined with a swing of almost 8%, made the seat much safer.
Daryl Melham narrowly held on in 2010 despite a 9% swing, and in 2013 he lost to Liberal candidate David Coleman with a further 3.3% swing.
Candidates
- Chris Gambian (Labor)
- Sharon Wu (Family First)
- Philippa Clark (Greens)
- David Coleman (Liberal)
- Greg Bondar (Christian Democratic Party)
- Roy Barnes (Animal Justice)
- Bob Spanswick (Independent)
Assessment
Banks is a very marginal seat and could well fall if there is a general swing to Labor, but the suburbs along the Georges River have been gradually trending towards the Liberal Party. The overlapping state seats of East Hills and Oatley, both key marginal seats, swung towards the Liberal Party despite a statewide pro-Labor swing at the 2015 election.
Polling
- 50-50 – Galaxy commissioned by Daily Telegraph, 11 May 2016
2013 result
| Candidate | Party | Votes | % | Swing | Redist |
| David Coleman | Liberal | 39,899 | 47.0 | +1.5 | 47.6 |
| Daryl Melham | Labor | 34,835 | 41.0 | -1.9 | 40.0 |
| Paul Spight | Greens | 4,242 | 5.0 | -4.6 | 5.0 |
| Jake John Wellham | Palmer United Party | 2,125 | 2.5 | +2.5 | 3.2 |
| Mark Falanga | Christian Democratic Party | 1,983 | 2.3 | +2.3 | 2.4 |
| Sayed Khedr | Independent | 768 | 0.9 | +0.9 | 0.7 |
| Ross Richardson | Katter’s Australian Party | 553 | 0.7 | +0.7 | 0.5 |
| Robert Michael Haddad | Democratic Labour Party | 470 | 0.6 | +0.6 | 0.4 |
| Others | 0.1 | ||||
| Informal | 9,374 | 11.0 |
2013 two-party-preferred result
| Candidate | Party | Votes | % | Swing | Redist |
| David Coleman | Liberal | 43,990 | 51.8 | +3.3 | 52.8 |
| Daryl Melham | Labor | 40,885 | 48.2 | -3.3 | 47.2 |
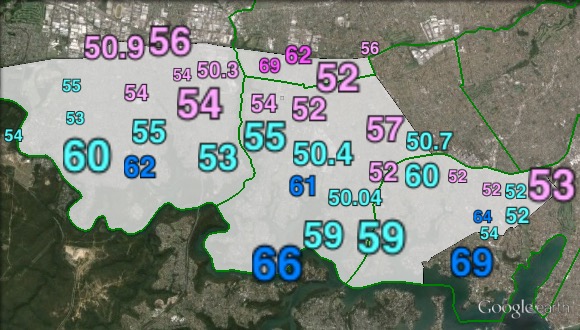
Booth breakdown
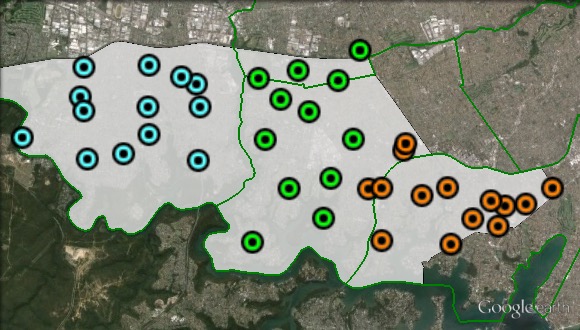
Booths have been divided into three parts. Those booths in the Bankstown local government area are included in the west. The centre covers those in Canterbury council area and most of Hurstville council area. Those in Kogarah council area, and a small part of Hurstville, are grouped in the east.
The Liberal majority of the two-party-preferred vote ranged from 51.8% in the west to 53.7% in the east.
| Voter group | LIB 2PP % | Total votes | % of votes |
| East | 53.7 | 22,234 | 24.5 |
| West | 51.8 | 22,401 | 24.7 |
| Central | 52.1 | 20,842 | 23.0 |
| Other votes | 52.9 | 25,258 | 27.8 |
as long as you don’t print anything…
The order of candidates (and limited range of credible non-major alternatives) is a big plus for Gambian.
If the usual 1-1.5% donkey vote materialises, then he is almost half way there even without any merit assessment.
The split between FF and CDP will weaken the capacity of either making a dent. If the right were better unified then they could be polling like the Greens at, or even higher than 5% and getting the electoral funding. Obviously, not good news for the LNP if they had to take these guys (oops, diversity PC alert) more seriously in policy negotiations and candidate pre-selection.
That said, if the high non-attendance/informal vote of the last poll is repeated, then the Electoral Commission/Fed Govt will have some substantial public funding savings again.
Well, the local meet the candidates event last night at Revesby Workers spent most of its time dealing with education -from schools (State issue), to TAFE (State again) thru to Uni’s and the CSIRO cuts. (If you took out the education union and staff from the total numbers (they were at least half) there was probably a block of 10 Chinese against Communist funding and programs in Australian schools, and maybe another 20 people there.
The Animal Rights guy was passionate and advanced some high level arguments for procedural and economic reforms to reduce the impact of intensive farming and slaughtering processes, but, vegetarianism was a step too far for some.
The independent spoke a lot of sense, the CDP and FF obviously spent quality time at home with their families and Coleman spent a lot of time deflecting government cuts and defending trickle down economics whilst The Greens and ALP spent time congratulating each other on their relative progressiveness.
One clear outcome for this writer was the acknowledgement of all three major party candidates that they had no idea what the public purpose and benefit was for securing SSM and in fact “Cis” Gambion acknowledged there was no public policy reasons for retaining marriage at all. A real tribute to Catholic Education and the Labor way!
Galaxy poll has Lib 52%, ALP 48% for Banks
Those numbers from Galaxy look A LOT more in line with what we have seen previously. Its conclusion is also one I agree with – Coleman to retain with a minor swing away from him.
UPDATE: Just an update on the signage situation, a lot more Coleman signs have popped up in the east in the last few weeks. I speak mainly of Connells Point and that area. Although it is a safe Liberal area, the signage is still interesting to note.
The CDP candidate reckons he didn’t show at the candidate debate because of ‘threats’
My prediction: With the Georges River suburbs now safeish-safe Liberal, longtime member Daryl Melham gone, and David Coleman an established MP, Banks should stay Liberal in 2016.
Well, I will do my best to see Coleman to the door anyway…
Prediction: Liberal to retain this
Thanks for the summary. Just arrived back into the country in time for the elections.
As I expected, the Liberals held this seat. Early in the night Coleman looked like he was in deep trouble.
A Liberal win of 51-49. Perhaps a bit more after postals. Pretty close for a seat ALP HQ had reportedly “written off”. (Contrast with Reid, similarly written off, which swung to the Libs.)
I was scrutineering for Labor at the booth the AEC dubs Panania Central. It was an encouraging result as we won the booth with a swing more than double that required across the electorate as a whole. Alas it was not a typical result. The places formerly in Hughes tended to have the biggest swings.
I’m intrigued by the increase in the Christian Democrats vote. In my booth it was twice the Greens vote. Unsurprisingly their preferences flowed strongly Liberal (more so than the Greens did Labor). I have heard that a lot of local Libs dislike the Turnbullite Coleman. This may be a reflection of that.
Banks will no doubt be a key seat next time.
@DW true, my father was among those normally rock-solid Lib voters disgruntled with Coleman’s moderate tendencies. Labor only gained 1% of the 4% drop in the Lib PV.
This is a fascinating seat IMHO. Coleman is certainly doing very well on postals, breaking 57.9% in his favour. He’s managed to make up almost ~ 1% thus far, bringing his margin to around 2%.
As the counting has continued, Labor have only managed to get a 0.1% swing towards them on the PV. In fact, the Liberal Party recorded a positive swing towards them in the Oatley West booth of 2.7% and an even bigger swing of 4.7% in the Hurstville prepoll! Methinks the Asian vote was quite decisive here.
In any case, as DW says, Banks will remain a key marginal well into the future.
DW – “I’m intrigued by the increase in the Christian Democrats vote. In my booth it was twice the Greens vote. Unsurprisingly their preferences flowed strongly Liberal (more so than the Greens did Labor). I have heard that a lot of local Libs dislike the Turnbullite Coleman. This may be a reflection of that.”
Given Coleman’s primary was down by 3% and CDP up by a similar amount, the message was clear enough. Fortunately for Coleman both the Mediscare and Chinese Christian Church campaign was ramped up after the pre-polling rort was well under way. You could also add the FF vote of 1.7% to this “warning.” See if David is smart enough to get the message!
Informal rate is c. 7%, an improvement on last election – 3% more decided to make a decision rather than just ignore the tweedle dee/dum option.
Oops, 3% more chose not to turn up at all…!
Banks (NSW)
Enrolment:104,959
Turnout:85.79%
Informality:6.91%
it’s pretty bad all around…
Turnout by state
New South Wales 82.19 down by -11.12
Victoria 78.75 -14.65
Queensland 79.57 -13.98
Western Australia 75.74 -14.65
South Australia 82.27 -11.19
Tasmania 86.92 -7.81
Australian Capital 79.01 -15.66
Northern Territory 73.77 -8.45
Total 80.14 -12.92
Turnout by state
State Enrolment Turnout % Swing %
New South Wales 5,087,171 4,181,072 82.19 -11.12
Victoria 3,963,538 3,121,089 78.75 -14.65
Queensland 3,075,709 2,447,230 79.57 -13.98
Western Australia 1,578,462 1,195,482 75.74 -14.65
South Australia 1,183,049 973,246 82.27 -11.19
Tasmania 373,584 324,715 86.92 -7.81
Australian Capital Territory 282,126 222,915 79.01 -15.66
Northern Territory 133,020 98,124 73.77 -8.45
Total 15,676,659 12,563,873 80.14 -12.92
I don’t think those turnout figures include all of the postals, absent and out-of-electorate pre-polls yet.
Yes, jumped the gun,,,
Banks (NSW)
Enrolment:104,959
Turnout:91.91%
Informality:6.87%
So 8% didn’t show and almost 7% that did, didn’t get it right??
Formal 13,114,538 94.95 +0.86
Informal 697,128 5.05 -0.86
Total 13,811,666 88.10
as at 18 July…Nationally.