Geography
Regional Western Australia. O’Connor is a massive electorate, covering the southern half of Western Australia away from the heavily-populated south-western corner of the state. O’Connor covers the major centres of Kalgoorlie, Albany and Esperance, as well as southern parts of the wheatbelt. The seat stretches as far west as Bridgetown and Manjimup.
2013 result
| Group | Party | Votes | O’Connor % | Statewide % |
| AA | Liberal | 29,616 | 34.51 | 39.20 |
| U | The Nationals | 17,941 | 20.90 | 5.07 |
| Z | Australian Labor Party | 14,894 | 17.35 | 26.59 |
| S | The Greens (WA) | 5,725 | 6.67 | 9.49 |
| F | Palmer United Party | 3,676 | 4.28 | 5.01 |
| B | Liberal Democrats | 2,835 | 3.30 | 3.43 |
| C | Australian Christians | 1,979 | 2.31 | 1.64 |
| G | Shooters and Fishers | 1,803 | 2.10 | 1.04 |
| I | Sex Party | 1,327 | 1.55 | 1.49 |
| D | Help End Marijuana Prohibition (HEMP) Party | 963 | 1.12 | 1.07 |
| Others | 5,071 | 5.91 | 5.98 |
The Liberal Party won the most votes in O’Connor, but with 4.7% less than across the state. The Nationals polled almost 21% in O’Connor, compared to just over 5% across the state. The ALP polled over 9% less than across the state. O’Connor is the only electorate where the ALP did not poll in the top two.
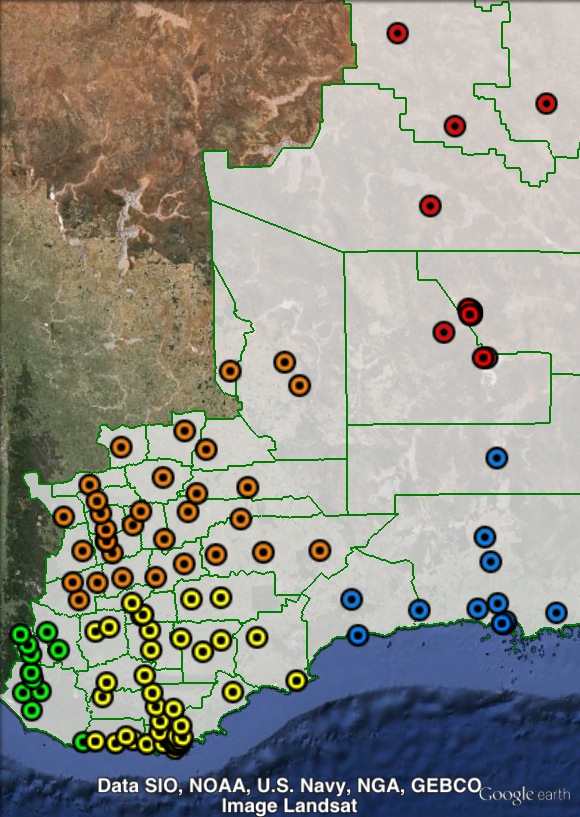
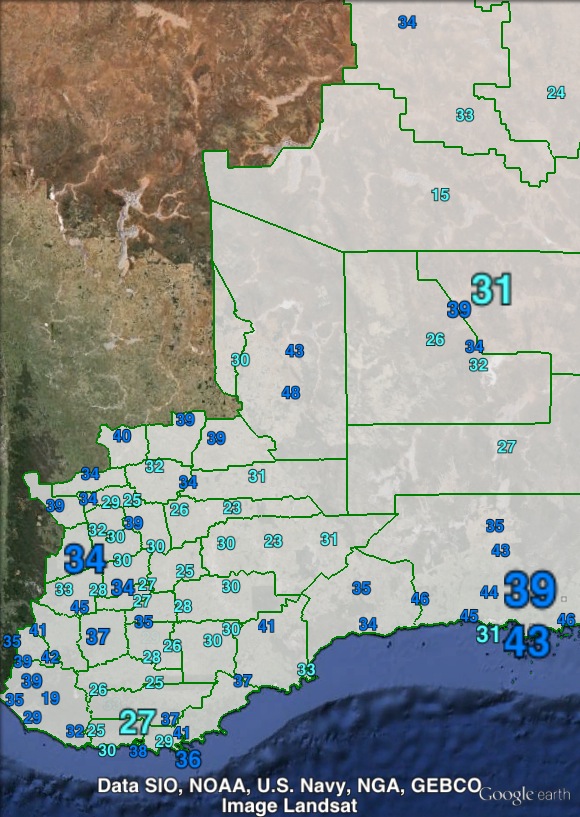
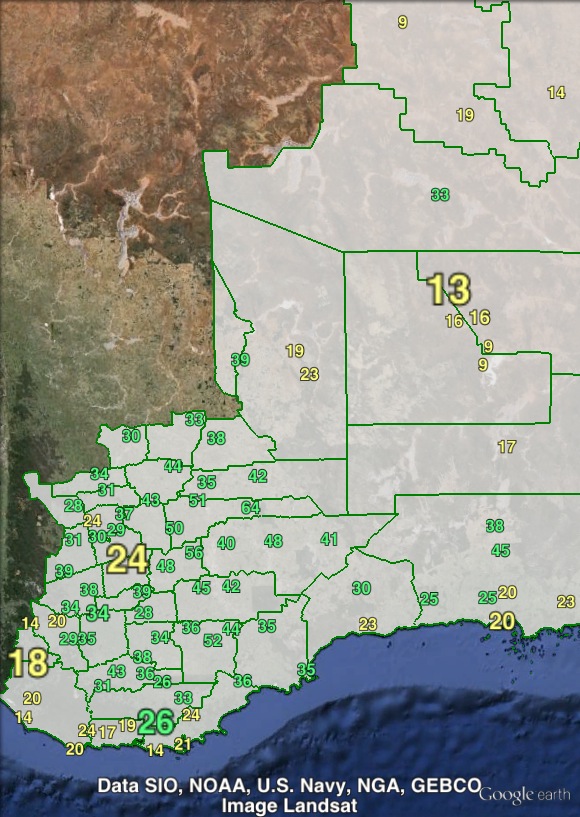
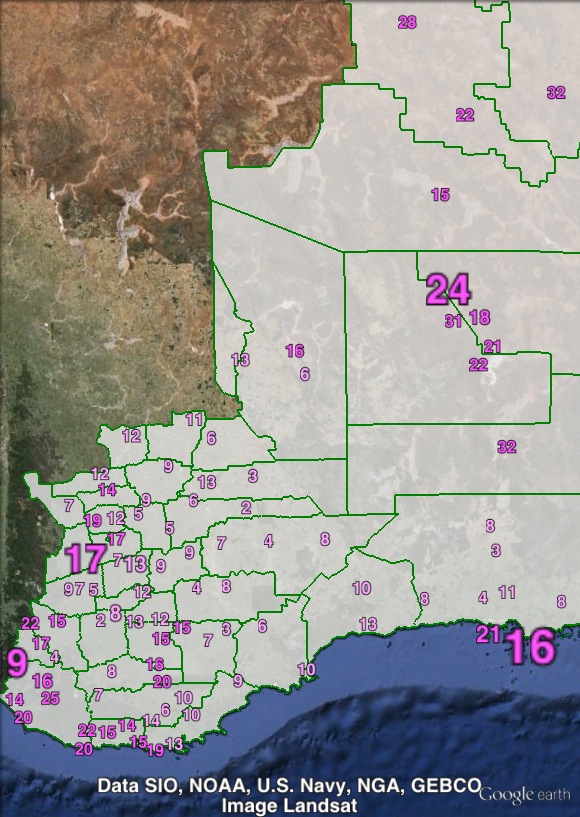
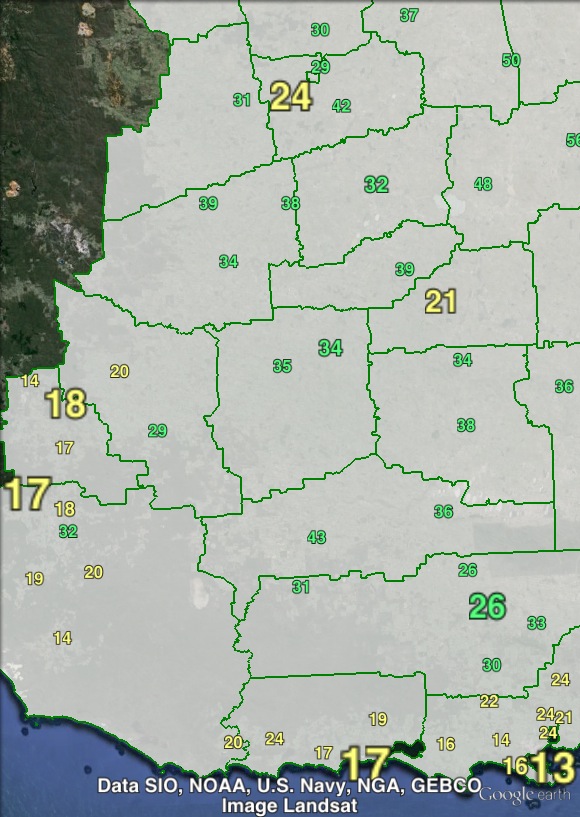
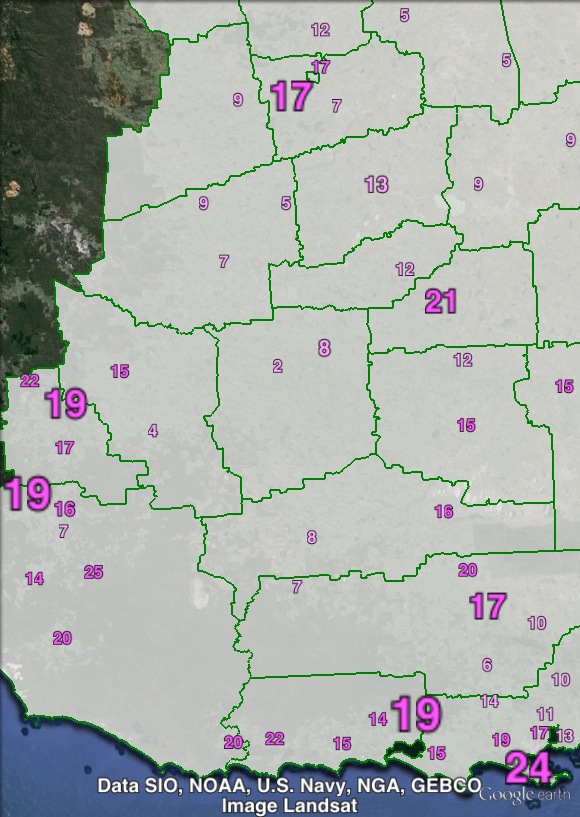
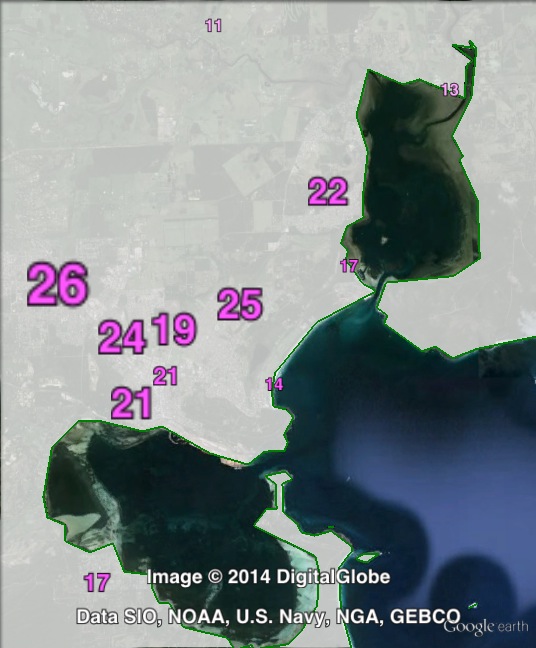
Booth breakdown
Booths have been divided into five areas, along local government areas. There are a large number of council areas in O’Connor. Booths in the north-east, including Kalgoorlie, have been grouped as Goldfields. Booths in the south-east include Esperance. The ‘Great Southern’ area includes Albany. The remainder has been split into Wheatbelt and South West.
The Liberal Party topped the poll in all five areas, including by a handful of votes in the Wheatbelt. The Nationals came second in Great Southern, Wheatbelt, South West and South East. The ALP came second in the Goldfields.
The Greens came fourth, with a vote ranging from 2.9% to 9.4%.
| Voter group | LIB % | NAT % | ALP % | GRN % | Total votes | % of votes |
| Great Southern | 30.78 | 20.58 | 18.35 | 9.42 | 26585 | 30.97 |
| Goldfields | 36.66 | 13.21 | 21.12 | 3.61 | 10966 | 12.78 |
| Wheatbelt | 33.87 | 33.77 | 11.31 | 2.88 | 10431 | 12.15 |
| South West | 35.59 | 18.01 | 17.2 | 9.28 | 7179 | 8.36 |
| South East | 38.18 | 21.71 | 15.36 | 5.71 | 6634 | 7.73 |
| Other votes | 36.58 | 19.83 | 17.75 | 6.16 | 24035 | 28 |