ALP 8.8%
Incumbent MP
Lisa Baker, since 2008.
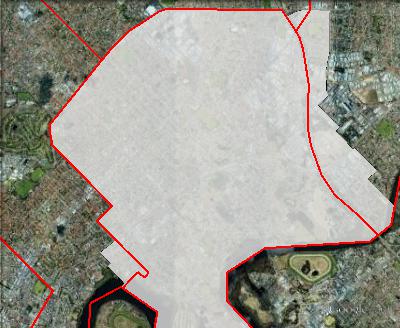
Geography
North-eastern Perth. Maylands mostly lies in the City of Bayswater, with a small part in the City of Stirling. The district covers the suburbs of Bedford, Embleton and Maylands,and parts of Bayswater, Inglewood and Morley.
Redistribution
Maylands expanded, gaining areas on its eastern boundary for Bassendean and the remainder of Maylands from Mount Lawley on its western boundary. The ALP’s margin was cut slightly from 9% to 8.8%.
History
Maylands has existed continuously since 1930. The ALP has won the seat at every election bar one since 1956.
John Harman won the seat back in 1968 for the ALP after one term of a Liberal Party MP. He held the seat until his retirement in 1986.
Harman was succeeded by Peter Dowding, a cabinet minister and a Member of the Legislative Council since 1979. Dowding became Premier in 1988, and served for two years before being ousted in 1990.
Dowding resigned from Maylands in 1990, triggering a by-election that was won by Judy Edwards.
Edwards held Maylands for eighteen years, serving as a minister from 2001 to 2006, and retiring in 2008.
Lisa Baker won Maylands in 2008, again as the Labor candidate.
Candidates
- Sylvan Albert (Liberal)
- Paul Madden (Australian Christians)
- Dee O’Neill (Greens)
- Lisa Baker (Labor)
Assessment
Maylands is a reasonably safe Labor seat, and should stay in Labor hands unless the Liberal swing is very large.
2008 result
| Candidate | Party | Votes | % | Swing |
| Lisa Baker | ALP | 8,065 | 43.7 | -10.8 |
| Ainslie Gatt | LIB | 6,270 | 33.9 | +7.4 |
| Hsien Harper | GRN | 3,524 | 19.1 | +7.2 |
| Dunstan Hartley | CDP | 614 | 3.3 | -0.4 |
2008 two-candidate-preferred result
| Candidate | Party | Votes | % | Swing |
| Lisa Baker | ALP | 10,899 | 59.0 | -8.4 |
| Ainslie Gatt | LIB | 7,572 | 41.0 | +8.4 |
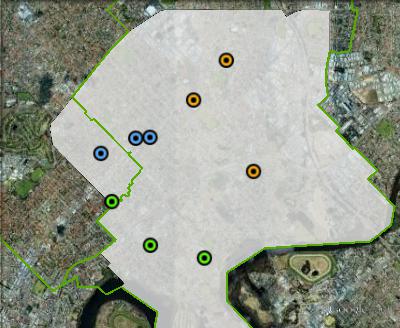
Booth breakdown
Booths have been divided into three parts: south, east and west.
The ALP polled over 45% in the east, compared to 41.8% in the south. The Liberal vote peaked at 35.8% in the west. The Greens polled just under 18% in the east and west, and over 21% in the south.
| Voter group | ALP % | LIB % | GRN % | Total votes | % of ordinary votes |
| East | 45.55 | 32.60 | 17.97 | 5,915 | 40.40 |
| South | 41.76 | 34.70 | 21.05 | 4,646 | 31.73 |
| West | 43.47 | 35.77 | 17.87 | 4,079 | 27.86 |
| Other votes | 43.26 | 33.16 | 19.67 | 3,833 |


Prediction: ALP Retain