NAT 42.92% vs LAB
Incumbent MP
Louise Upston, since 2008.
Geography
Central parts of the North Island. The electorate covers all of the South Waikato and Taupo council areas, and parts of the Waipa council area. The main towns are Taupo, Cambridge and Tokoroa.
Redistribution
No change.
History
The electorate of Taupō first existed from 1963 to 1984, and again since 1996. The seat has a history of switching back and forth between Labour and National. The seat was held by National for three terms from 1963 to 1972. From 1972 to 1984, the seat changed hands at every election. Labour held the seat for four terms from 1996 to 2008, but since then the National Party has built up a very strong margin in the area.
In 1993, the seat of Tongariro (covering similar areas to Taupō) was won by Labour’s Mark Burton. He moved to Taupō in 1996. Burton served as a cabinet minister in the Labour-led government from 1999 to 2007. He was re-elected in Taupō in 1999, 2002 and 2005.
At the 2008 election, Burton was defeated by the National Party’s Louise Upston, and his position on the Labour list was too low to return to the Parliament.
Burton’s margin had peaked at 26.7% over the National Party in 2002, and dropped to 4.43% in 2005. This slim margin was completely obliterated by Upston in 2008, and she won with an 18.5% margin. Upston more than doubled her margin to almost 43% at the 2011 election.
Candidates
- Lance Gedge (Conservative)
- John Pemberton (Democrats #3)
- Edwin Perry (New Zealand First #23)
- Dave Robinson (Green #53)
- Alan Simmons (United Future #2)
- Jamie Strange (Labour #54)
- Louise Upston (National #27), Member for Taupō.
- Claire Winitana (Māori #18)
Assessment
On paper, Taupō is a very safe National seat, with the twelfth-largest National margin in the country. Despite these numbers, the seat has a recent trend of being won by Labour for four terms from 1996 to 2008. If there is a swing back to Labour, Taupō may well swing above average. This is unlikely to happen in 2014.
2011 election results
| Electorate Votes | Party Votes | ||||||
| Candidate | Party | Votes | % | Swing | Votes | % | Swing |
| Louise Upston | National | 20,934 | 63.65 | +5.74 | 19,003 | 56.31 | +2.74 |
| Frances Campbell | Labour | 6,819 | 20.73 | -18.71 | 6,844 | 20.28 | -8.92 |
| Zane McCarthy | Green | 2,056 | 6.25 | +6.25 | 2,549 | 7.55 | +3.05 |
| Edwin Perry | New Zealand First | 1,508 | 4.59 | +4.59 | 2,833 | 8.39 | +3.25 |
| Mark Breetvelt | Conservative | 900 | 2.74 | +2.74 | 1,236 | 3.66 | +3.66 |
| Keriana Reedy | Mana | 266 | 0.81 | +0.81 | 140 | 0.41 | +0.41 |
| Alan Simmons | United Future | 216 | 0.66 | -0.42 | 311 | 0.92 | +0.12 |
| Rosanne Jollands | ACT | 190 | 0.58 | +0.58 | 394 | 1.17 | -2.34 |
| Māori | 226 | 0.67 | -0.25 | ||||
| Legalise Cannabis | 157 | 0.47 | +0.13 | ||||
| Libertarianz | 22 | 0.07 | +0.03 | ||||
| Democrats | 20 | 0.06 | -0.01 | ||||
| Alliance | 12 | 0.04 | -0.02 | ||||
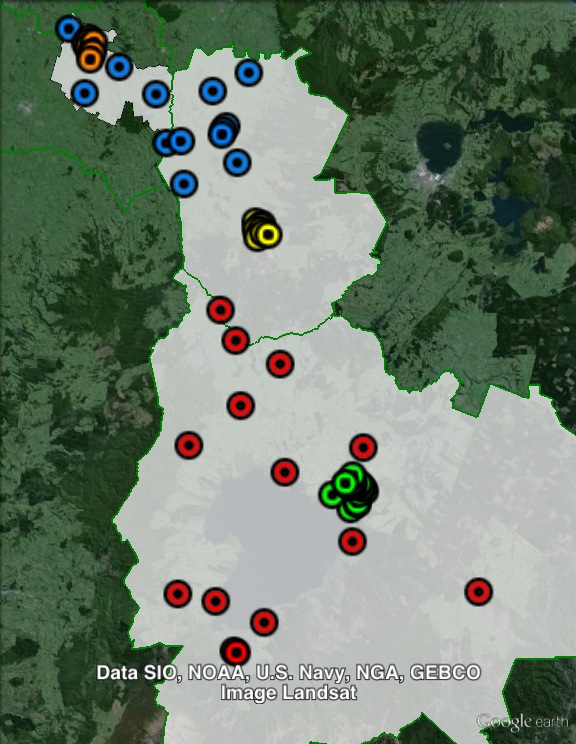
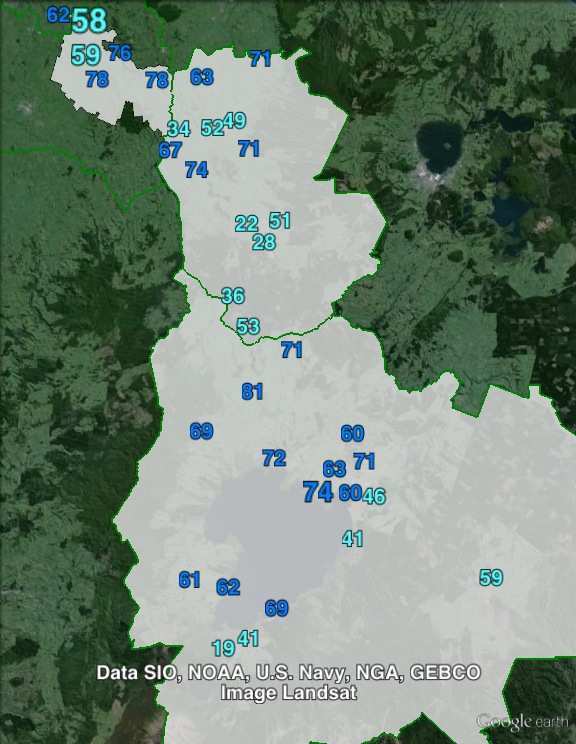
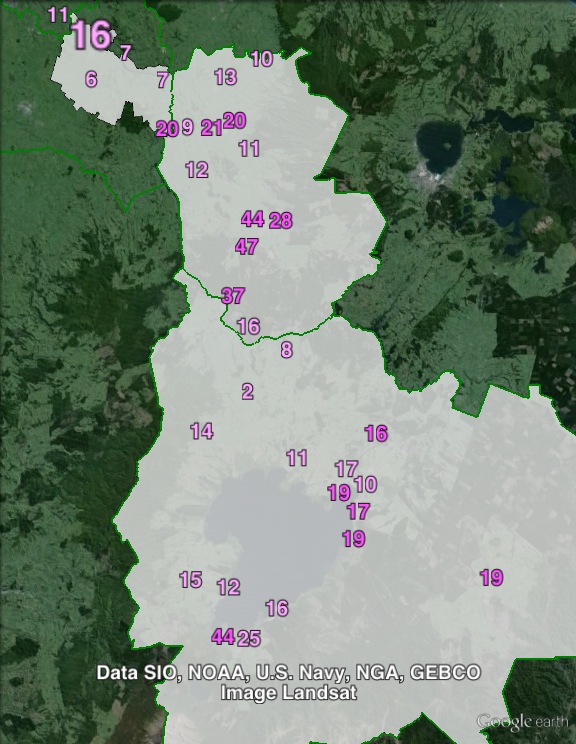
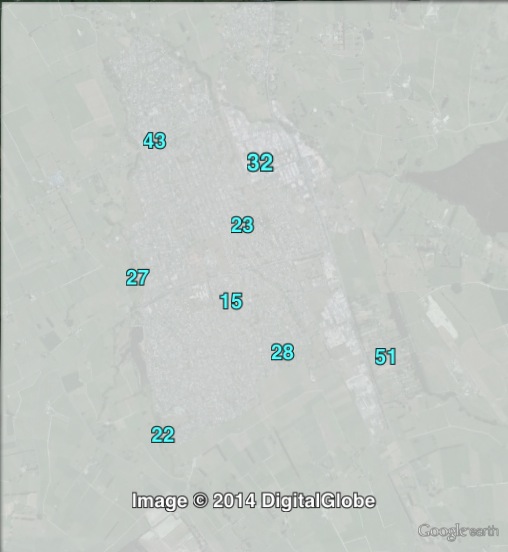
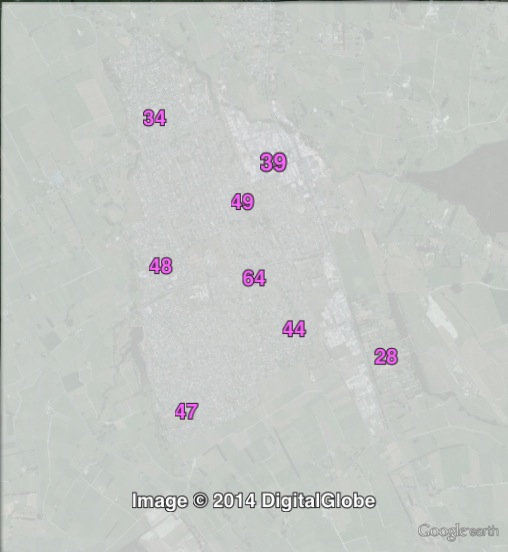
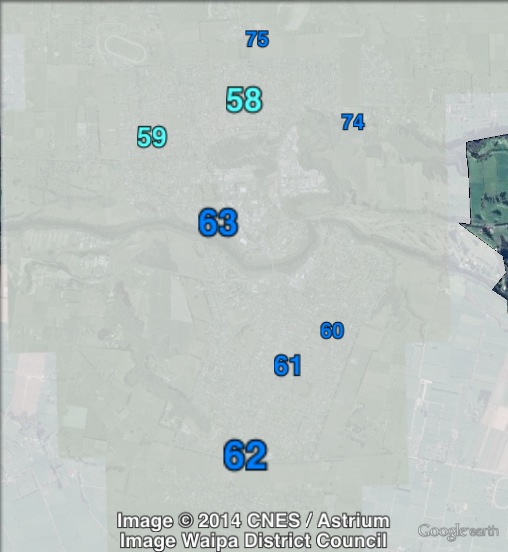
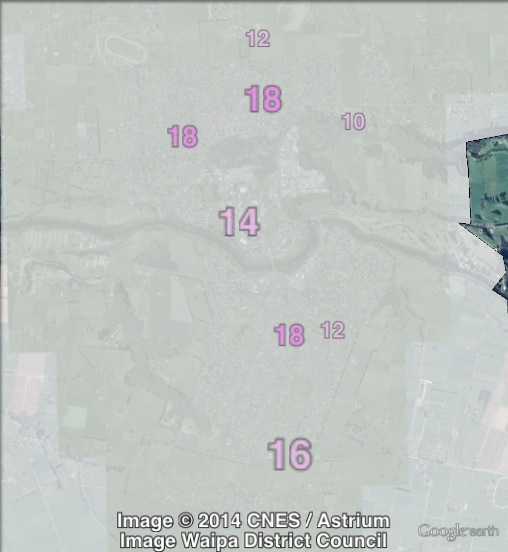
Booth breakdown
Booths in Taupō have been divided into five areas. Polling places in the three largest towns of Taupo, Cambridge and Tokoroa have been grouped together. The remaining rural booths have been split into “North” (containing those in South Waikato and Waipa council areas) and “South” (those in Taupo council area).
The National Party won large majorities in four out of five areas: Taupo, Cambridge, North and South. The National electorate vote ranged from 62% in the south to 69% in Cambridge, while the party vote ranged from 55% in the south to 63% in Cambridge. In all of these areas the Labour vote was 15-20%,.
In Tokoroa, Labour won a majority of both electorate and party votes, with 43-44% of the vote.
New Zealand First came third in the party vote, with the Green Party not far behind. New Zealand First outpolled the Greens in Tokoroa and the northern and southern regions, while the Green Party narrowly outpolled New Zealand First in Taupo and Cambridge.
| Voter group | Electorate votes | Party votes | Total | % of votes | ||||
| NAT | LAB | NAT | LAB | NZF | GRN | |||
| Taupo | 68.62 | 16.75 | 60.10 | 17.01 | 7.65 | 7.77 | 7,577 | 23.04 |
| Cambridge | 69.36 | 16.51 | 62.54 | 15.65 | 7.43 | 8.07 | 6,621 | 20.13 |
| Tokoroa | 37.08 | 43.88 | 30.38 | 43.61 | 12.08 | 6.53 | 3,824 | 11.63 |
| North | 66.41 | 16.38 | 60.27 | 14.85 | 9.51 | 6.99 | 3,614 | 10.99 |
| South | 62.02 | 20.26 | 55.38 | 18.71 | 8.58 | 7.38 | 2,359 | 7.17 |
| Other votes | 65.91 | 19.22 | 58.24 | 19.06 | 7.68 | 7.70 | 8,894 | 27.04 |