NAT 44.06% vs LAB
Incumbent MP
Maurice Williamson, since 1987.
Geography
Eastern suburbs of Auckland. Pakuranga covers the suburbs of Bucklands Beach, Howick, Mellons Bay and Pakuranga, on the eastern edge of the Auckland urban area, bordered to the north by the ocean.
Redistribution
No change.
History
Pakuranga has existed since the 1963 election. The seat was first won by Labour for three successive elections, but since 1972 has been won by National at all but one election.
In 1984, Pakuranga was won by Neil Morrison, running for the Social Credit Party. At the time, the party held only two seats in the Parliament. The party changed its name to the Democratic Party in 1985.
In 1987, Morrison lost Pakuranga to the National Party’s Maurice Williamson. Williamson has held Pakuranga ever since, winning a ninth term in 2011. Williamson served as a junior minister in the National government from 1990 to 1996, and served as a minister again from 2008 to 2014. In 2014, he was forced to resign due to his intervention in a police investigation into a party donor.
Candidates
- Andrew Craig (Conservative)
- Barry Kirker (Labour)
- Jamie Whyte (ACT #1)
- Maurice Williamson (National #35)
Assessment
Pakuranga is a very safe National seat.
2011 election results
| Electorate Votes | Party Votes | ||||||
| Candidate | Party | Votes | % | Swing | Votes | % | Swing |
| Maurice Williamson | National | 20,694 | 65.86 | +4.28 | 20,471 | 62.80 | +3.10 |
| Sunny Kaushal | Labour | 6,848 | 21.79 | +0.17 | 6,068 | 18.62 | -3.66 |
| Lance Gedge | Conservative | 1,634 | 5.20 | +5.20 | 1,156 | 3.55 | +3.55 |
| Helen Mulford | New Zealand First | 1,430 | 4.55 | +1.26 | 1,847 | 5.67 | +2.18 |
| Chris Simmons | ACT | 816 | 2.60 | -3.74 | 585 | 1.79 | -5.39 |
| Green | 2,024 | 6.21 | +2.61 | ||||
| United Future | 149 | 0.46 | -0.50 | ||||
| Legalise Cannabis | 112 | 0.34 | +0.12 | ||||
| Māori | 109 | 0.33 | +0.03 | ||||
| Mana | 40 | 0.12 | +0.12 | ||||
| Alliance | 20 | 0.06 | +0.02 | ||||
| Libertarianz | 9 | 0.03 | -0.01 | ||||
| Democrats | 5 | 0.02 | 0.00 | ||||
Booth breakdown
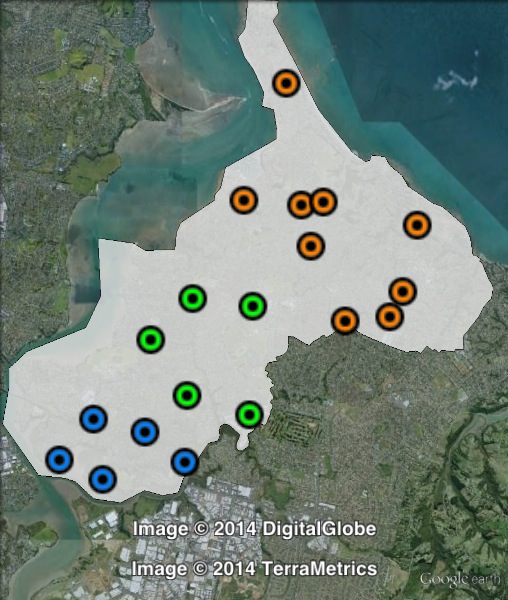
Booths in Pakuranga have been divided into three parts: Central, North and South.
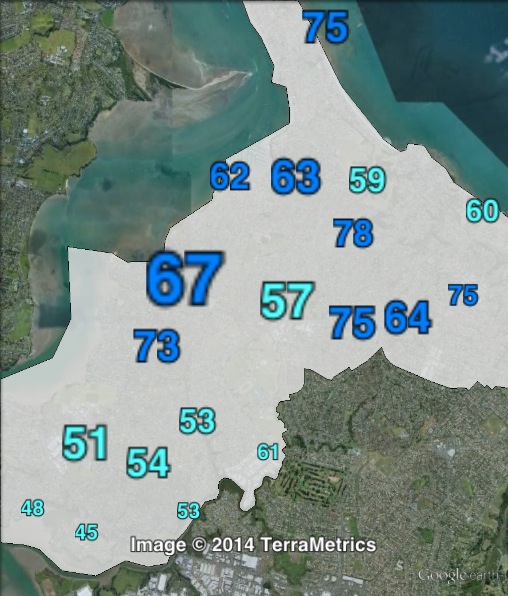
The National Party won a majority in all three votes, with a vote ranging from just over 50% in the south to 68-70% in the north.
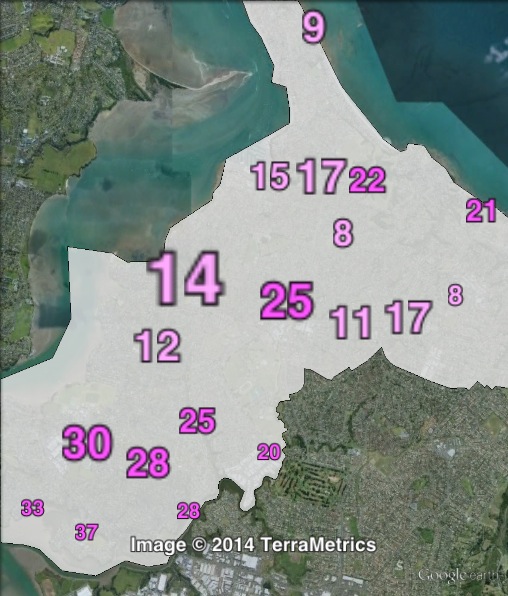
Labour’s vote peaked at over 30% in the south, as opposed to 14% of the party vote and 17% of the electorate vote in the north.
| Voter group | Electorate votes | Party votes | Total | % of votes | |||||
| NAT | LAB | NAT | LAB | GRN | NZF | CON | |||
| North | 70.37 | 17.40 | 68.02 | 14.08 | 6.22 | 4.79 | 3.63 | 10,934 | 34.80 |
| Central | 66.34 | 21.47 | 62.97 | 18.56 | 5.82 | 5.95 | 3.26 | 6,871 | 21.87 |
| South | 52.21 | 34.13 | 50.90 | 30.69 | 5.81 | 6.48 | 3.21 | 4,363 | 13.89 |
| Other votes | 66.61 | 21.41 | 62.23 | 18.26 | 6.66 | 6.08 | 3.81 | 9,254 | 29.45 |