

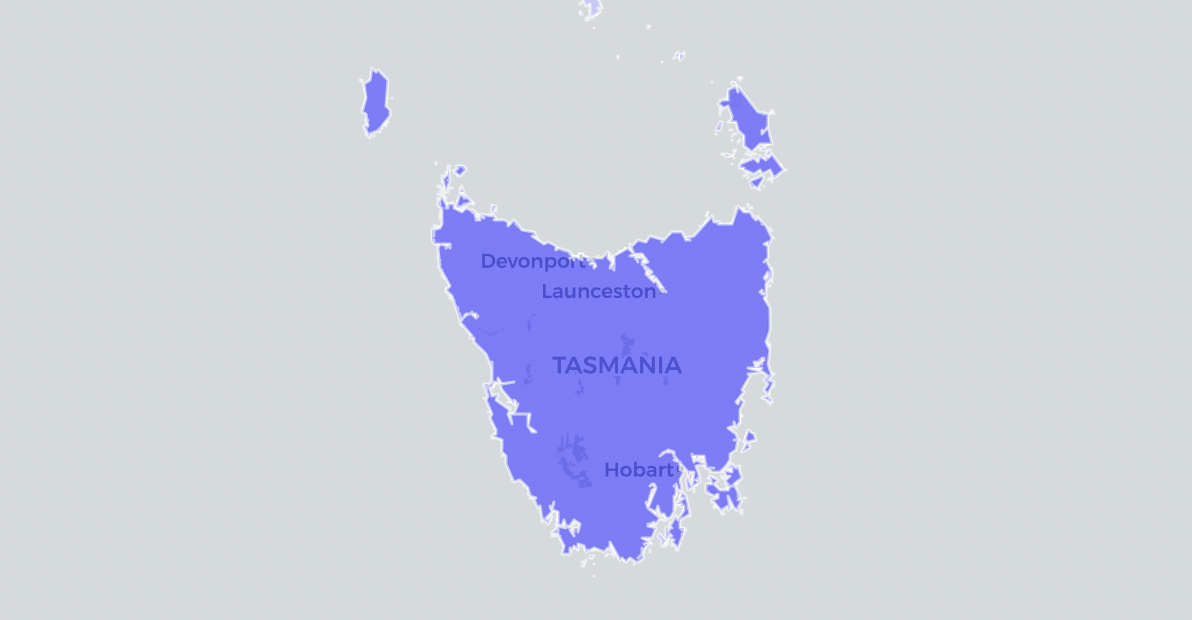
9:35 Thursday – I have now compiled my own version of the Tasmanian federal electoral map. On this map below, you can toggle on and off the new boundaries, old boundaries and the drafts, with the seat names toggled separately. This live blog is now finished.
11:47 – I’m going to wrap up here. Over the next few days I will produce a map showing the new boundaries, which should allow me to also produce seat guides for the Tasmanian federal electorates, but I will wait for the final boundaries in South Australia before getting to work on the next wave of my federal election guide. When that map is done, I will add it here.
11:46 – This table compares pre- and post-redistribution percentages and quotas for each group. The numbers change slightly for Bass and Lyons but all the commentary I provided in February is still relevant.
One thing I noticed while producing this table this time: Kristie Johnston has 0.7 quotas in Clark, despite only contesting about half the seat. But she also has 0.4 quotas in Lyons, which is pretty impressive considering most of the seat wasn’t able to vote for her. I suspect she would stick with Clark, but a Johnston-backed candidacy in Lyons could also be interesting.
| Electorate | Group | Pre % | Pre Q | Post % | Post Q |
| Bass | Liberal | 41.80 | 3.344 | 41.21 | 3.297 |
| Labor | 27.52 | 2.202 | 27.62 | 2.209 | |
| Greens | 16.51 | 1.321 | 16.60 | 1.328 | |
| Others | 4.58 | 0.366 | 4.59 | 0.367 | |
| Shooters | 4.08 | 0.327 | 4.27 | 0.342 | |
| Razay | 3.48 | 0.278 | 3.25 | 0.260 | |
| Nationals | 2.03 | 0.162 | 2.47 | 0.197 | |
| Clark | Liberal | 30.64 | 2.451 | 31.35 | 2.508 |
| Greens | 22.06 | 1.765 | 22.10 | 1.768 | |
| Labor | 27.01 | 2.161 | 20.70 | 1.656 | |
| George | 9.35 | 0.748 | |||
| Johnston | 15.04 | 1.203 | 8.85 | 0.708 | |
| O’Byrne | 4.21 | 0.337 | |||
| Archer | 3.34 | 0.267 | 1.94 | 0.155 | |
| Others | 1.91 | 0.153 | 1.50 | 0.120 | |
| Lyons | Liberal | 42.01 | 3.361 | 39.96 | 3.132 |
| Labor | 28.44 | 2.275 | 30.15 | 2.410 | |
| Greens | 13.56 | 1.084 | 12.56 | 1.035 | |
| Others | 5.02 | 0.402 | 10.33 | 0.827 | |
| Shooters | 6.74 | 0.539 | 4.39 | 0.351 | |
| Nationals | 4.24 | 0.339 | 2.61 | 0.209 | |
| Tongerlongeter | Liberal | 34.37 | 2.749 | 36.84 | 2.947 |
| Labor | 22.78 | 1.822 | 27.24 | 2.179 | |
| Greens | 13.54 | 1.083 | 13.45 | 1.076 | |
| George | 17.12 | 1.370 | 8.64 | 0.691 | |
| O’Byrne | 11.26 | 0.901 | 7.66 | 0.613 | |
| Others | 0.93 | 0.075 | 6.16 | 0.493 |
11:33 – Here are the estimates of the percentage vote for each party group per electorate.
| Electorate | LIB | ALP | GRN | IND | NAT | SFF |
| Bass | 41.2 | 27.6 | 16.6 | 7.8 | 2.5 | 4.3 |
| Braddon | 49.8 | 23.7 | 7.4 | 14.2 | 1.6 | 3.3 |
| Clark | 31.3 | 20.7 | 22.1 | 25.9 | 0.0 | 0.0 |
| Tongerlongeter (Franklin) | 36.8 | 27.2 | 13.5 | 18.6 | 1.4 | 2.5 |
| Lyons | 40.0 | 30.1 | 12.6 | 10.3 | 2.6 | 4.4 |
And here are the estimates of quotas.
| Electorate | LIB | ALP | GRN | IND | NAT | SFF |
| Bass | 3.2966 | 2.2093 | 1.3276 | 0.6272 | 0.1974 | 0.3418 |
| Braddon | 3.9835 | 1.8971 | 0.5930 | 1.1324 | 0.1272 | 0.2665 |
| Clark | 2.5076 | 1.6557 | 1.7679 | 2.0679 | 0.0000 | 0.0000 |
| Tongerlongeter (Franklin) | 2.9471 | 2.1795 | 1.0760 | 1.4841 | 0.1135 | 0.1998 |
| Lyons | 3.1321 | 2.4098 | 1.0350 | 0.8242 | 0.2330 | 0.3656 |
Next up I’ll put up a table comparing pre-redistribution and post-redistribution figures for the main groups in each seat.
11:14 – 27.6% of voters have been moved into a new seat. That number is exactly the same as on the draft boundaries.
It’s worth remembering that the scale of the federal redistributions in this term is quite minor. Only three states and one territory are redrawing the map, and in every case the number of seats stays the same (which minimises the need for change). That means as a starting point 102/150 seats are unaffected. Two more seats (Fenner and Braddon) have now been confirmed to have no changes. The South Australian draft redistribution proposed no changes to three other seats. So this would mean 107 out of 120 seats would be unchanged, before we start redrawing the Queensland map.
11:11 – It will not be that difficult to draw a map of these new boundaries – take the draft boundaries, rename Franklin, change the Launceston-area boundary back to the 2025 boundary, and then swap Break O’Day LGA – but I won’t get that done today. Sorry for that! Should be done by Friday.
11:09 – And I just realised I don’t need to calculate a 2CP margin for Clark since it was already done for the draft boundaries.
| Electorate | Old margin | New margin |
| Bass | ALP 8.0% | ALP 8.3% |
| Braddon | ALP 7.2% | ALP 7.2% |
| Clark | IND 20.4% | IND 9.2% |
| Lyons | ALP 11.6% | ALP 12.7% |
| Tongerlongeter (Franklin) | ALP 19.4% | ALP 18.7% |
11:07 – It will take me slightly longer to estimate 2CP margins for Clark, but this table shows primary votes and 2PP for each seat.
The Labor margin in Bass on the draft boundaries and on the 2025 boundaries was 8.0%. Now it is 8.3%. The Labor margin for Lyons had grown from 11.6% on the 2025 result to 13.1% on the draft boundaries. It is now 12.7%. There are no changes to Braddon (since the previous boundaries) or to Clark or Tongerlongeter (since the draft boundaries).
| Electorate | ALP 2PP | LIB 2PP | ALP prim | LIB prim | GRN prim | IND prim |
| Bass | 58.3 | 41.7 | 39.8 | 31.1 | 12.9 | 5.2 |
| Braddon | 57.2 | 42.8 | 39.5 | 31.7 | 8.4 | 8.2 |
| Clark | 70.2 | 29.8 | 26.6 | 17.0 | 13.0 | 39.0 |
| Lyons | 62.7 | 37.3 | 33.7 | 22.3 | 10.3 | 21.1 |
| Tongerlongeter (Franklin) | 68.7 | 31.3 | 43.4 | 20.0 | 10.9 | 16.7 |
10:24 – The Australian Electoral Commission has just announced the final Tasmanian federal boundaries, although there will be further consultation on a new name. The draft version of this redistribution was published in February and you can find my analysis of those boundaries here.
The AEC media release is here and there is more information here.
The draft involved very minor changes to northern Tasmania but completely redrew the southern half of Tasmania, with Clark losing Glenorchy and picking up the rural south-west of Tasmania, Franklin losing those south-western areas and spreading up the east coast of Tasmania, while Lyons pushed into Hobart by picking up the Glenorchy area.
I have only had a chance to quickly read the AEC media release, but it appears that they are maintaining the draft boundaries in southern Tasmania, but are proposing to rename Franklin as ‘Tongerlongeter’. The AEC has given the following explanation of this name:
Tongerlongeter (c. 1790-1837) is recognised by historians as one of the most significant Tasmanian Aboriginal leaders during the early period of British colonisation. As a member of the Oyster Bay nation, Tongerlongeter’s Country is within the proposed boundaries of the electorate.
The Commission has also made some changes to the proposed boundary between Bass and Lyons. Bass will now gain the Break O Day local government area on the north-east coast, but will not gain Prospect Vale or Blackstone Heights on the south-western outskirts of Launceston.
The boundaries appear to be final, but there will be a chance for further consultation on the name Tongerlongeter.
These boundaries are also expected to be applied for Tasmanian state elections, with each electorate sending seven members to the House of Assembly. But this process is not automatic – the state Parliament will need to adopt the new boundaries once the federal process is completely finished. I will also be calculating state election vote shares once I have the maps and data, but it takes a bit longer than a federal redistribution, so probably won’t be done today.

Well if he liked oysters that’s good enough for me.
Failing to include parts of suburban Launceston in Bass, as originally proposed, in favour of adding the remoter north eastern coast seems less than ideal.
Less than 20 years ago Lyons stretched to the coast in the east, north, and west. Now it’s landlocked.
Just this afternoon the AEC has announced that it will stay with the name Franklin for the Hobart Eastern Shore and East Coast (up to Bicheno) Division, and not rename it Tongerlongeter (or to any other name) in this redistribution.