
The Greens won the seat of Prahran from third place on the primary vote in 2014. They won it again in 2018, again from third place. Yet in 2022 it’s quite plausible the Greens could lose the seat despite potentially increasing their primary vote into first place. This is due to the complex ways preferences and order of elimination play out in races where there are more than two strong candidates.
In this post I’m going to explore how three-candidate-preferred results interact with preference flows to decide who wins a seat, which explains a lot about the kinds of lower house seats the Greens have won (and not won) over recent years.
When you conduct a full distribution of preferences in a single-member electorate, the final result is the two-candidate-preferred count. But the stage before it could also be called the three-candidate-preferred (3CP) count. And this is the count that determines which two candidates make the final round.
While it has traditionally been rare for a candidate who hasn’t polled in the top two on primary votes to make it to the final count, it has become more common. Greens MP Sam Hibbins has pulled it off twice in Prahran, while the Greens also won the federal seat of Brisbane from third place earlier this year. Independent MP Andrew Wilkie also achieved this feat when he first won his seat in 2010. I wrote a blog post in June exploring how the gap between second place and third place has been narrowing over time.
Traditionally the key count is the two-candidate-preferred count, since there are usually two major party candidates well out in front of their rivals. But in the seats of Macnamara and Brisbane at the federal election, that round became less important than the round before it. Depending on who was knocked out of the 3CP round, their preferences decided who would end up winning the seat, and not by a slim margin.
In both of these seats, the Greens expected to do very well out of Labor preferences, but would have been easily beaten if Liberal preferences were distributed, since the Liberal Party had preferenced Labor on their how-to-vote cards. In Brisbane, Labor was knocked out, and their preferences elected the Greens. In Macnamara, the Greens were knocked out and their preferences elected Labor.
Preference flow rates are not always the same, but the patterns are usually similar. For this post, I’m examining races from federal, Victorian and Queensland elections, ignoring New South Wales as the optional preferential voting system changes how these preferences flow.
At the federal election, there were 84 seats where the three-candidate-preferred count was between Labor, Coalition and the Greens. In 75 of these seats, the Greens were knocked out. The Labor candidate was knocked out in three seats, all in inner Brisbane, while in six other seats in inner city Melbourne, Sydney and Canberra, the Liberal candidate was knocked out.
First looking at preference flows from the Greens to Labor, on average 79.6% of Greens preferences flowed to Labor at the 2022 federal election.
Looking at Labor preferences to the Greens:
- 81.9% on average in three seats in Brisbane at the 2022 federal election
- 81.3% in Prahran in 2018
- 87.1% in Prahran in 2014
- 74.6% in Maiwar (QLD) in 2020
- 80.7% in Maiwar in 2017
So on average it’s usually around 80-82%, although Prahran in 2014 was an outlier.
Looking at Liberal preferences to Labor over the Greens:
- 65.8% in six seats at the 2022 federal election
- 57% in three seats at the 2018 Victorian state election
- 68.9% in four seats at the 2014 Victorian state election
- 36.2% in South Brisbane at the 2020 Queensland state election
The Liberal National Party preferenced the Greens over Labor in South Brisbane in 2020. Incidentally I believe this is the only time the Coalition has preferenced the Greens in a Greens-Labor contest since Adam Bandt first won the federal seat of Melbourne in 2010 with about 78% of Liberal preferences.
So bearing in mind this variability in preference flows, this next chart shows which party wins for any given 3CP vote in four different scenarios.
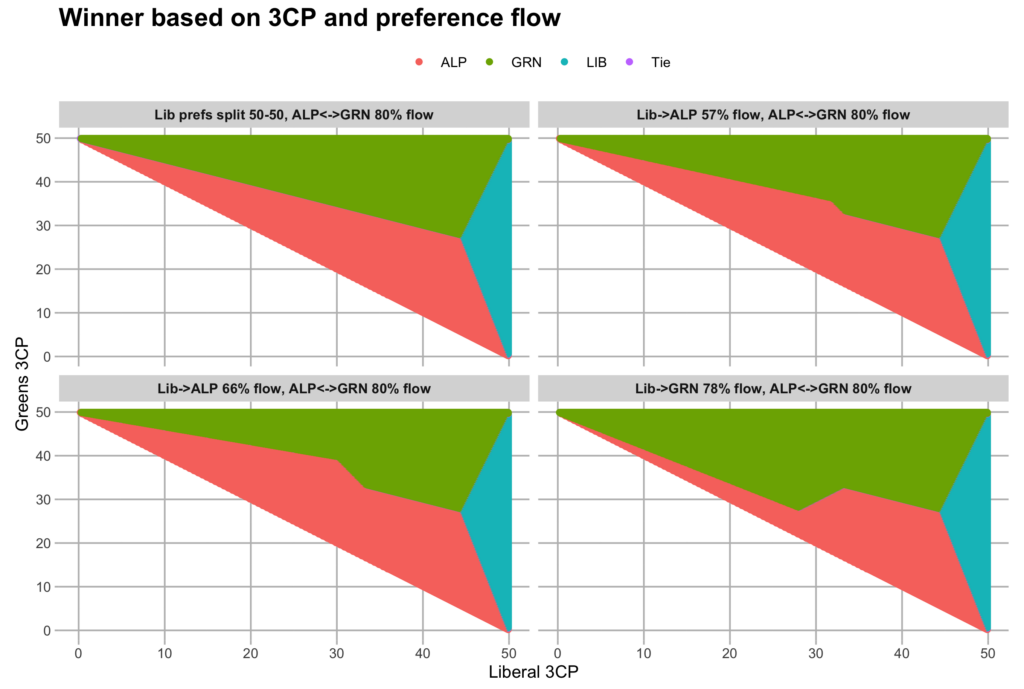
This graph shows the Greens 3CP on the Y axis and the Liberal 3CP on the X axis, with the Labor 3CP able to be derived from those other two numbers, since the three numbers add up to 100%. The chart shows every potential 3CP combination where no candidate polls 50% or more on the 3CP, and the colour indicates which party would win in that scenario on that 3CP.
With Labor and Greens both preferencing each other with a rate of about 80%, the Liberal Party doesn’t have much of a chance. They need at least 44% of the 3CP vote and then need a reasonably even split between their opponents to eke out enough preferences to win.
In the four scenarios, the line demarcating a Labor win from a Greens win varies. If the Liberal preferences split evenly, 50-50, that line is straight. Whoever is leading between Labor and Greens wins, unless the Liberal Party can gain enough of a lead to win with the few progressive preferences leaking.
But in the other scenarios there is a kink which kicks in around the spot where the Liberal Party drops out of the top two. As long as the Liberal is in the top two, the winner is the other candidate in the lead. But once the Liberal drops into third, the party benefiting from their preferences gains a large advantage.
The Greens did much better on Liberal preferences in Victoria in 2018 than in the 2022 federal election, so the line for that scenario (57% preference flow to Labor) is less dramatic. Even more dramatic is the preference flow based on the Liberal preference flow to the Greens in Melbourne in 2010, which practically shut the door on Labor winning once the Liberal Party’s vote was too low to stay in the top two.
(Incidentally, there have been reports that the Liberal Party will preference the Greens ahead of Labor in the state election. This produced a preference flow of 64% in South Brisbane in 2020 and 78% in Melbourne in 2010, so would likely see the Greens strengthen their position in all of their seats and win at least two others.)
These graphs are based on some designed by Ben Messenger which he’s shown on his relative new Three Party Preferred blog. Go check it out. Also check out Alex Jago’s tool, which allows you to plug in your own preference assumptions and see the graph change.
So how does this relate to Prahran? In short, if the Liberal Party drops their primary vote, the 3CP will move towards the left on this chart, eventually reaching a point where the Liberal Party came third, and the race turns into a straight Greens-Labor contest, with Liberal preferences proving crucial, and they are expected to help Labor. It doesn’t mean the Greens can’t win, but they need a substantial lead over Labor to withstand those preferences, whereas they only need to beat Labor by a single vote on the 3CP as long as the Liberal Party are in first place, where their preferences can’t have an impact.
Next up I have two more charts showing the same information but with some examples of past contests involving the Greens.
This chart shows contests at federal and Queensland state elections. The preference flows are based on a flow of 66% from the Liberal Party to Labor in 2022.
You can see South Brisbane and Melbourne in the red zone, only won by the Greens thanks to a different Liberal preferencing decision (although Melbourne has gone on to become safe for the Greens since then). You can also see that the Greens wins where the Liberal Party made the top two appear at the right of the chart: Prahran, Maiwar and the three new Greens seats earlier this year. The Greens 3CP is often lower in those races than in seats where they lost: Wills and Cooper in particular.
And unsurprisingly Macnamara, which came very close to a three-way tie, is right on the boundary line. The Queensland state seats of McConnel and Cooper are actually quite closely clustered near Macnamara. They have a higher Liberal vote than straight Labor-Greens races like South Brisbane, Cooper (federal) and Wills, but lower than in places like Maiwar. This is a danger zone for the Greens. The Liberal vote is low enough to be in danger of dropping into third, but it is still possible they will stay in the top two. A slight shift from Labor to Greens could be enough, as long as the Liberal vote holds up.
Now let's look at the same chart but for Victorian state seats. For this chart, I've assumed a weaker flow of preferences from Liberal to Labor, so the border between the red zone and the green zone is slightly different.
The first thing I notice is Prahran in 2014 solidly in the blue area. Hibbins benefited from 87% of Labor preferences in the final distribution in 2014, much higher than the 80% assumed generally. He wouldn't have won if he received the typical rate of Labor preferences.
It's also worth noting that the preference flow from Liberal to Labor became much less favourable to the ALP between 2014 and 2018, so there's at least two Labor seats won in 2014 that would have been lost to the Greens off the same 3CP if preference flows were more like they were in 2018: Richmond and Brunswick. Also note that the Greens 3CP in Prahran in both 2014 and 2018 was lower than in Northcote, Richmond or Brunswick in 2014, or Northcote in 2018 (we have no appropriate 3CP in Richmond due to the Liberal Party not standing).
This is a long post but I hope this method of analysing three-cornered contests can prove useful and I can refer back to this post as an explanation of the method. Thanks again to Ben Messenger for the inspiration with the chart design. When it comes to Prahran on election night, keep an eye on that Liberal vote!

As a Tally Room supporter, resident of Prahran and Reason Party candidate in the 2018 election (to take votes away from the Liberal Katie Clark …. yeah I know), this is absolutely fascinating, thank you very much.
Fascinating article and graphs Ben!
I’m expecting the 3CP count in Prahran this time around to have very similar numbers to 2018 but with the Greens & Liberals simply switching places in the race.
So rather than the Liberals being out in front (high 30s) with a close race between ALP & GRN for second place (low 30s); I’m expecting the Greens to be out in front in the high 30s with ALP & LIB battling it out for second place this time.
Makes me think our electoral system should be amended to always elect a Condorcet winner if one exists. Admittedly this would be to the detriment to the Greens, but very favourable for independents (Teals and others).
(For those who don’t know – a candidate is a Condorcet winner if they defeat every other candidate on a 2CP count.)
Nicholas, I wonder if OPV (optional preferences) may be a better solution because that way the Liberal Party doesn’t have to recommend preferences for Labor v Green contests. It would also reflect on the proportion of 1st preferences better, as the winner would usually be the one who has a stronger lead on primary vote.
Although if the contest was really close (top three candidates all getting 30-35% primary vote) then it would still be quite difficult to predict the winner.
@Yoh An
I support OPV too, but out of the principle that voters should have as much freedom as possible in how they cast their vote.
I don’t believe at all that an electoral system should necessarily favour a higher first preference vote. I mean, that is exactly what FPTP is.
I view the Condorcet criterion as a natural extension of preferential voting – if a candidate can defeat every other candidate on a 2CP, why shouldn’t they be elected?
Saw today a big Liberal “Put Labor Last” billboard (not that there was any indication it was a Liberal billboard unless you recognised the name of the Liberal campaign director on the authorisation statement). I don’t know if this is an indicator that they intend to direct preferences to the Greens over Labor?
Their TV ads are saying the same too.
It would be very strange to run such a visible “Put Labor Last” campaign, and then not actually put them last on their HTV cards. I mean, it’s the Liberal Party so I wouldn’t put it past them because so far their campaign has been all over the place, but it look bad for their ability to keep their word if voters head into a polling place looking at huge “Put Labor last” signs then get handed a HTV that doesn’t put them last.
For those interested in the potential outcomes of a “Put Labor Last” campaign, take a look at the 2017 Queensland State Election results. It was a huge surge in non-classic contests and micro-parties. 28 contests ended with a non-classic 2CP. It was a breakthrough election featuring the first ever elected Greens MP, and the other side or the coin: the first ONP MP elected in a long while; and one more KAP seat to go with the other two they held.
Most non-classic contests featured ONP, against Labor in the outer-suburban fringes, and against LNP in rural & regional divisions.
That being said, I don’t expect ONP to be prominent in this Victorian state election at all. And 2017 was seemingly a high-watermark outlier for ONP support, unlikely to be replicated anytime soon, especially outside of Queensland.
I also don’t see UAP intending to be at all prominent in this election.
The most likely to feature in these non-classic contests is a surge of Independents. Greens are likely to improve on their position in their usual Victorian races.
There will likely be a few 4CP contests in Melbourne’s inner south-east that might result in some unforeseen snowball surges.
While these style of Coalition campaigns don’t generally result in a Coalition victory, they instead intend to damage the current position of the Labor incumbency by having them cede votes to other parties, putting them in non-classic contests and awkwardly wedging them in the middle. They then hope that this weakening of Labor will bode for them in their next stint of opposition.
I agree SEQ, I think with the election looking unwinnable for them, that is exactly their strategy.
However, that could very well backfire. If Labor end up in a minority government with the Greens, it removes the Liberals’ ability to blame everything on Labor. Sure they can run a scare campaign about a Labor-Greens government, but in a pretty safely left leaning state, all that might do (especially if Andrews passes the torch to a successor in 2026) is encourage voters back to Labor to ensure a majority government, and do so in landslide fashion again.
In a state where the best the Coalition can realistically do is win a very narrow majority, and any election in which they’re competitive will have a high chance of minority government, voters looking to avoid another minority government are hardly going to rush to them.
Further to your points SEQ and Trent, Victoria is probably the only state where the crossbenchers will be overwhelmingly left leaning due to the strong Green vote in inner Melbourne and the lack of true ‘outback’ rural areas that would be supportive of the minor right-wing parties in the mould of One Nation/KAP/SFF.
Although the independents running in the Western suburbs seats could be considered more right of centre, similar to Dai Le federally who has generally voted against Labor on most legislation.
Yoh An – A lot of the right wing support in Qld comes from places like Ipswich – hardly outback. In Victoria, Ground Zero for further right politics seems to be the Latrobe Valley – it is not outside the realms of possibility that a group to the right of the Nats could win in Morwell – possibly not this time but possibly in the future. With Group Voting continuing, a lot of these right win fringe dwellers could end up winning in the Upper House.
If the need for 3CP counts rises to the same proportion of contests in which 2CP counts were once relevant to the outcome, perhaps SEQ’s 4CP counts will be the “new 3CP” before long. The Independent in Groom, Susie Holt, just showed you can start out at 8.3% (in 4th place) on 1st preferences and end up at 43.1% in the 2CP! Was that a first?
How did they determine the 2CP was between the Liberals and Holt? Looking at the first preference count, it appears entirely plausible that Smolenski (the other independent, with a slightly lower primary vote) could have made it to the 2CP. What’s the process the AEC follows to make sure they get this right?
To partly answer my own question – to really make sure that Holt made it to the 2CP and not Smolenski, a 5CP would have been necessary. Did the AEC do this?
Even here, I’m also assuming that the AEC would be willing to make a decision on the basis that it is highly improbable that AFP, UAP, and Green preferences would pool together to get either the UAP or Greens ahead of one of the independents. Otherwise, a 6CP and 7CP count would have been necessary too!
I think what happens with preference distributions is that you start with n candidates, the lowest polling one is eliminated and then you have the votes for (n-1) candidates. This process then continues until you have the final 2CP count.
I believe with the case of Groom; Holt was ahead of Smolenski at the critical 5CP count. Smolenski was eliminated and that put Holt at 3rd place out of 4 candidates. From there, Holt made the 2CP count by leapfrogging Labor and gaining their preferences.
@Yoh An
Well, yes, that’s how it’s meant to be conducted in theory but I get the impression that the AEC takes shortcuts. Otherwise why did they announce that they were counting 3CPs?
I thought they only do the shortcut method during the initial post-election count, where two candidates who are believed to be the highest polling on primary votes will be chosen. If that initial 2CP count is wrong, or if the vote is very close, they will then proceed with the full distribution of preferences to determine the winner and/or actual 2CP count.
I think maybe the essence of the paradox in this seat is that
In theory Labor should win
But in practice it would not
Suprise me I’d the greens retain. What do the liberals who
Will poll a lower primary vote do
Preference Labor ahead of the greens as ideology suggests
Or preference the greens to stuff Labor up
Also on top of that how much
Will people ignore preference recommendations of their
Own parties and do their own
Thing. This combination of choice make the result between
The alp and greens uncertain
The AEC conducts 2CPs as a shortcut to get a quick result and they conducted the 3CPs in the same spirit, so that we didn’t have to wait for a full DoP to find out who won. That wasn’t in question in Groom, so we found out when they did the full DoP, then they went back and counted 2CP by booth (although they also have a full DoP by booth too).
Andrew
It may be a first for the House of Reps.
Not so for Australian Politics. As per my previous post, in the 1996 Melbourne City Council election, Malcolm Ritchie attained fourth place of seven. He saw off every exclusion, winning the election with a primary vote of 8%.
Did the Liberals run “open” HTV’s in Brunswick, Melbourne and Northcote in 2018? I can’t seem to find the VEC HTV archive but it may explain the weaker flows? Their respective primaries were also pretty low in those seats.
“Open” HTVs aren’t kosher according to VEC rules. In Victorian elections, an HTV with any blank boxes will be knocked back as it is considered to be open to misinterpretation and people accidentally think that can validly vote just with a 1.
Comments are closed.