
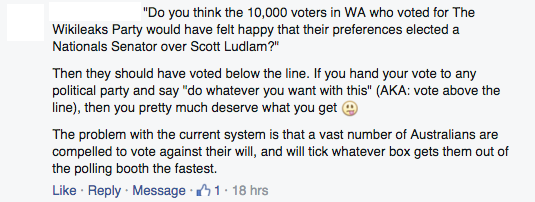
In the last few days, I’ve been involved in a lot of discussions about Senate reform, and many times I’ve had people insist that voters make a choice to hand control of their vote to their party, and any voter should be able to vote below-the-line if they wanted to. These arguments often insist that below-the-line voting is easy, and stray into elitist arguments about ordinary voters being lazy.
@DineshMathew @jon_lawrence @timhollo @thewetmale @daveyk317 Mate, democracy doesn’t get much easier then numbering 150 boxes.
— Van Badham (@vanbadham) February 17, 2016
Now there are multiple different reasons why voters lack informed choice when voting in the Senate, including how difficult it is to understand the impact of a GVT even when you’re an electoral expert, but I’m just going to focus on the idea that it’s easy to vote below-the-line, and thus voters have a reasonable option if they wish to opt out of the parties’ preference machine.
In short, approximately 30% of below-the-line votes end up in the informal pile, and as the number of candidates increase there is a corresponding increase in the overall informal rate, and a decline in the below-the-line rate.
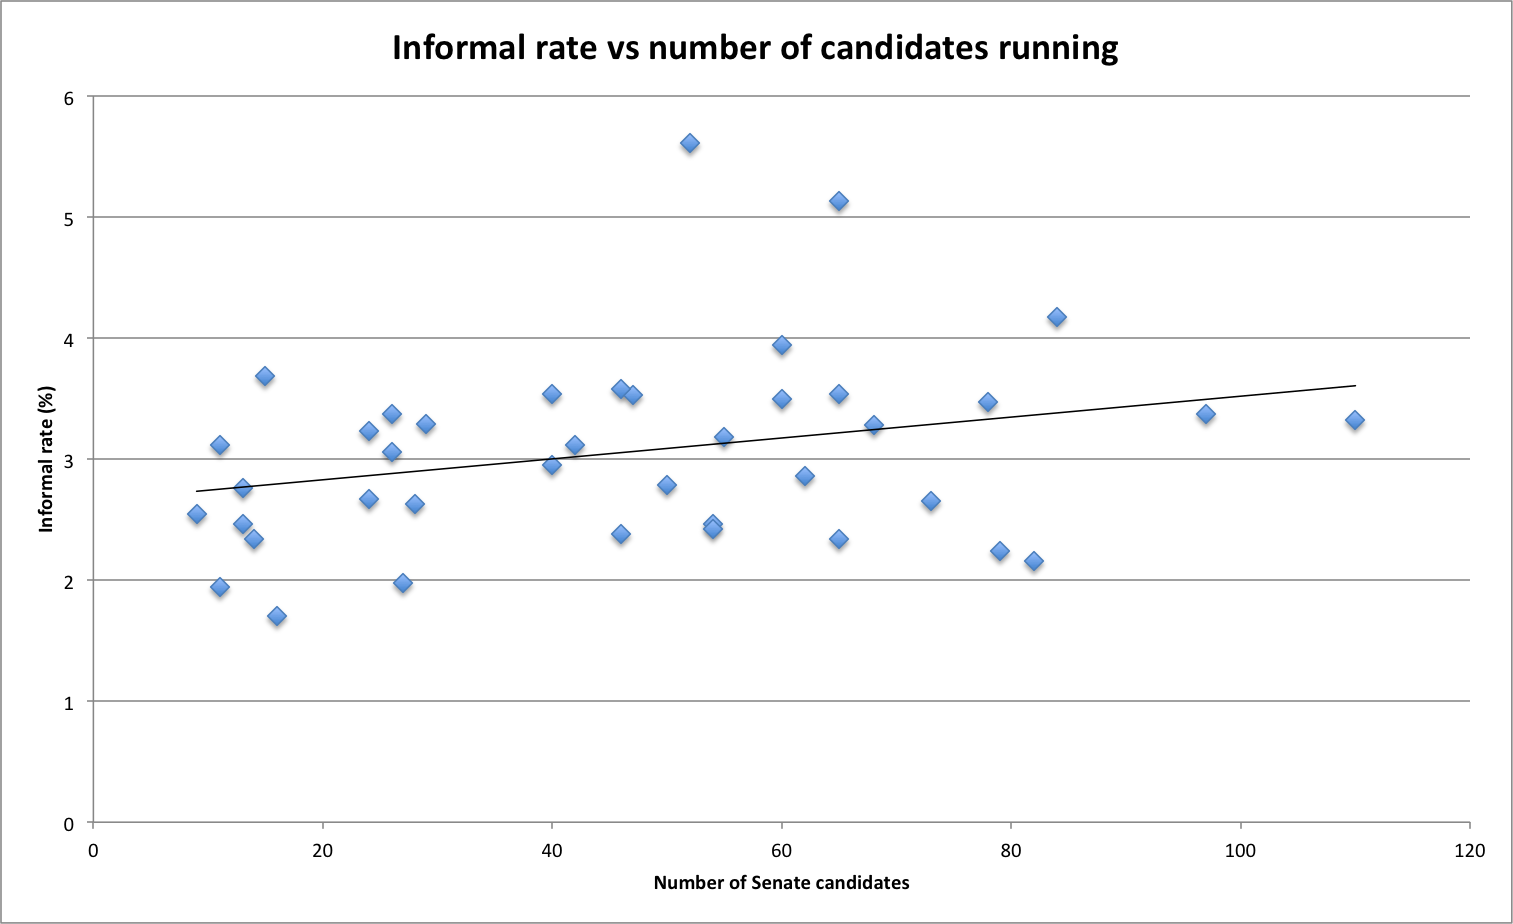
The first problem with below-the-line voting is the scale of the number of candidates. Van Badham might say that it’s easy to number 150 boxes, but there is a clear relationship between the number of candidates who run in a Senate race, and both the informal rate and the number of people who cast a formal below-the-line vote.
In jurisdictions like Tasmania and the ACT, below-the-line voting makes up a significant proportion – over 10% at every election since 2001, and close to 10% in the Northern Territory. Unsurprisingly, these jurisdictions usually have much smaller ballots, although in Tasmania we saw the below-the-line rate drop from 20.2% in 2010 to 10.3% in 2013 when the number of candidates increased from 24 to 54.
The correlation between the informal rate and the number of candidates running is 0.29 – definitely positive, but not a very strong relationship.
But when you look at how many voters choose below-the-line voting, there is a strong relationship – a correlation of 0.74 (where 1 is a perfect correlation).
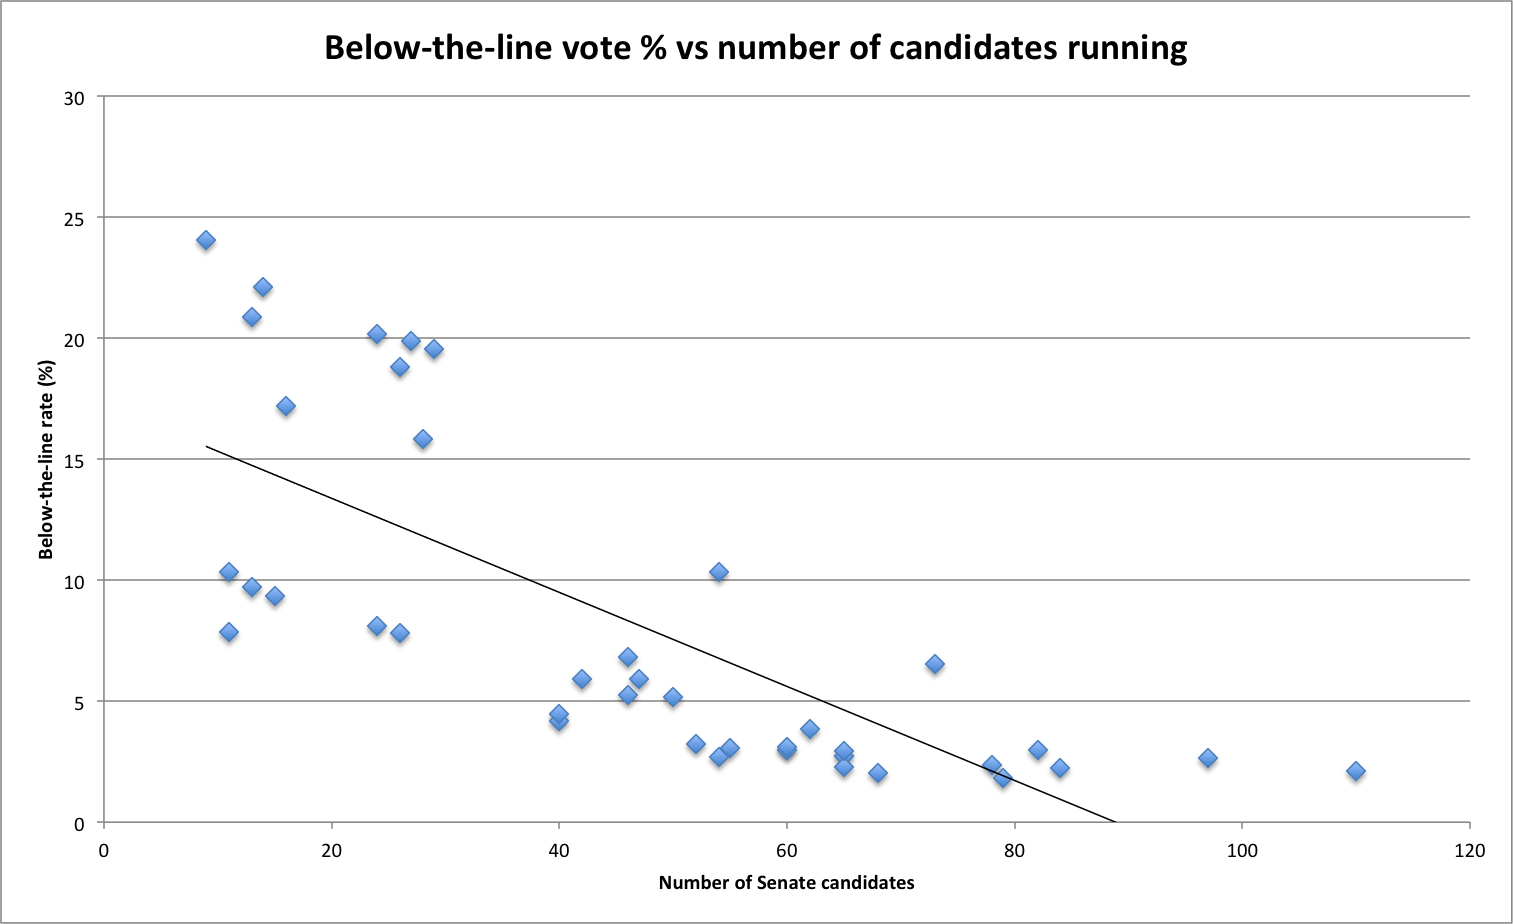
So the number of candidates running has a strong impact on whether people choose to opt out of the group voting ticket system. Considering how much more difficult it is to correctly vote below-the-line for 110 candidates (NSW 2013, 2.1% voted below-the-line) than for 14 candidates (ACT 2001, 22% voted below-the-line) we can only assume that voters in part vote above-the-line not because they trust their party, but because it is so much easier.
But what about the informal votes? If below-the-line votes make up a small part of the formal vote, is the same also true of informal votes? Actually, no. In 2001, the AEC conducted a survey where they examined all 470,961 informal Senate ballots and classified into twelve categories according to the reason the vote was informal. I’ve simplified this down to four categories:
| Type of error | % of informal vote | Estimated votes |
| Below-the-line error | 47.39% | 223,188 |
| Blank | 34.04% | 160,315 |
| Other | 11.01% | 51,853 |
| Above-the-line error | 3.31% | 15,589 |
In 2001, only 553,521 voters cast a formal below-the-line vote (this number has never gotten above 500,000 again since), yet over 200,000 people attempted to vote below the line and were considered informal.
This was an informal rate of 28.7% for people who tried to vote below-the-line, compared to an overall informal rate of 4.05%.
We haven’t gotten fresh data since 2001, but the system hasn’t changed – if anything it’s gotten harder to vote below-the-line, and as a consequence we saw a drop in the below-the-line votes and the informal vote down to 2007, and then it surged again in 2010.
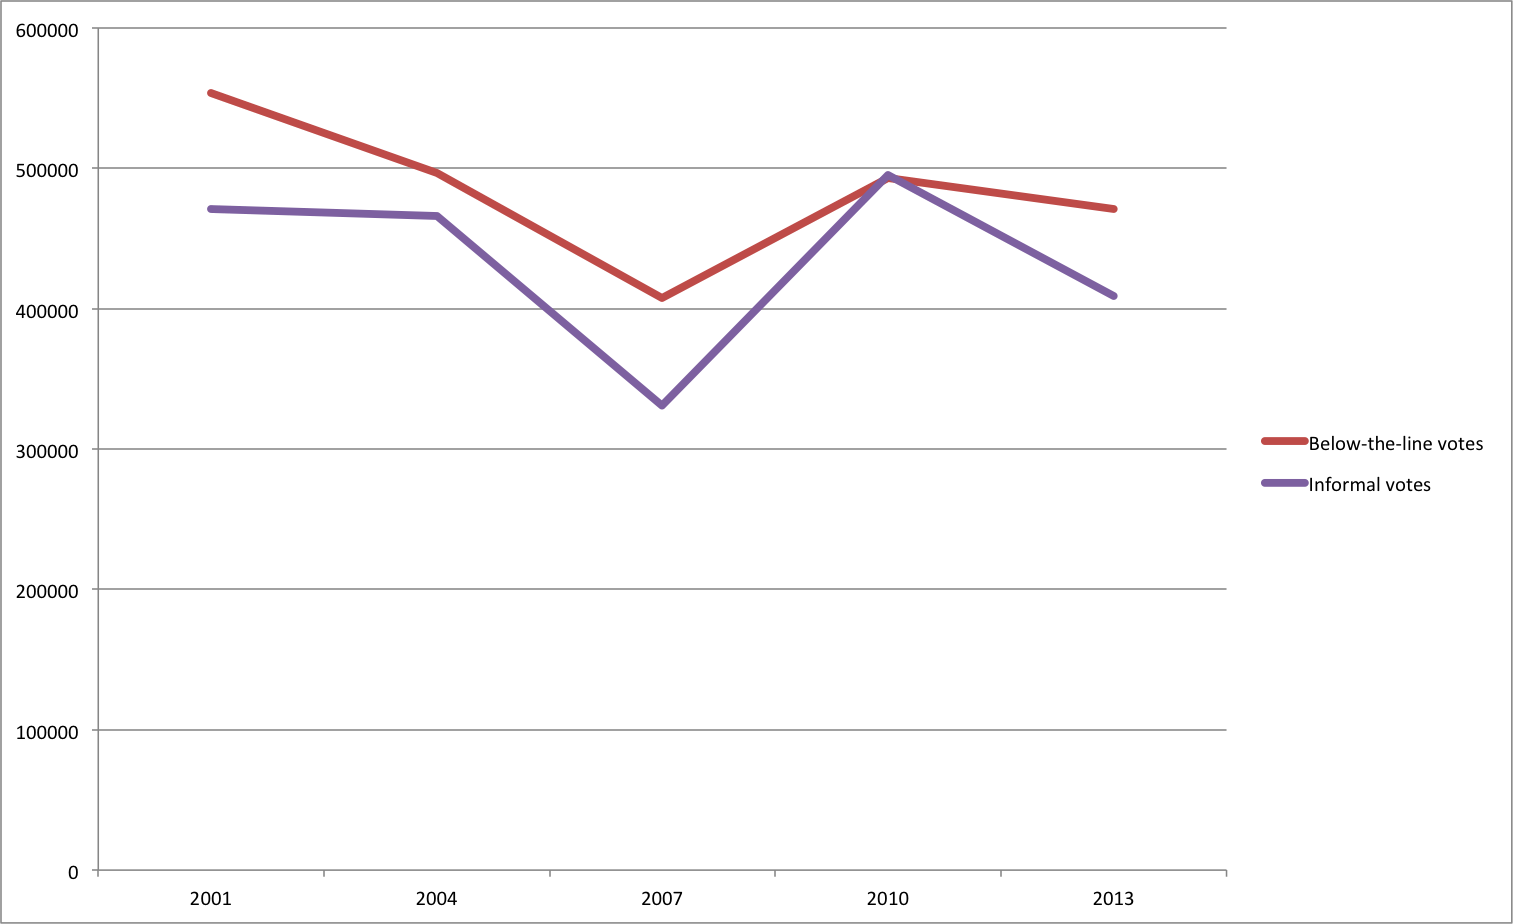
If you assume 47.4% of informal votes being below-the-lines, the below-the-line informal rate would have peaked at 32.2% in 2010 and been at 29.2% in 2013.
It’s also worth noting that the kind of person who chooses to vote below-the-line is probably more engaged in politics and has chosen to try to make up their own mind, yet we’ve seen an informal rate around 30% for people in that group.
In summary:
- It’s bloody hard to cast a formal vote below-the-line, due to the number of candidates. When the number of candidates increases, the informal rate increases and people don’t cast as many below-the-line votes.
- Of the informal vote, almost half are below-the-line, and errors below-the-line are 14 times more likely than above-the-line.
When you consider these facts, it is impossible to argue that voters have a reasonable alternative to putting their vote in the hands of their party. You cannot say that voters have made an informed and free choice to delegate their preferences to their party when the alternative is time-consuming and likely to make your vote informal (not to mention the difficulty of choosing between many dozens of completely unknown candidates).
Voters aren’t stupid or lazy to baulk at voting below-the-line. Voting should be made simple for people, but also structured so that votes count the way that voters would expect them to count. Letting voters choose their own preferences above the line, or cast a much easier below-the-line vote, will mean that voters have real freedom to vote above the line, below the line, for many candidates or for few.
Update: If you would like to do any further analysis, you can download the data here. One thing that was pointed out is that Tasmania and the ACT both have Hare-Clark for their state/territory elections, so voters are used to numbering below the line. If you remove those two states from the data, the relationship between below-the-line rate and the number of candidates becomes even stronger.

Excellent article, Ben, expresses very well some thoughts I’ve had around this discussion, especially around people disingenuously imputing voter intentions.
One minor point – the correlation you showed between below-the-line voting and number of candidates is already high, but the data looks more of a non-linear fit just from eyeballing it. Would you be able to check the correlation when the fit is log/exp?
Hi James, unfortunately I just did quick correlations in Excel. Happy to share the data if you want to try it.
I actually tried the data excluding Tasmania and the ACT (as the two jurisdictions where voters regularly use Hare-Clark) and the fit was much stronger. I might update the article.
Yes would love to try myself! Where can I find the data?
I’ll upload it and link to in article.
Okay the link to the spreadsheet is at the end of the article.
It is likely that the true relationship between sequence errors and number of candidates is non-linear, but the data is aggregate so includes non-numbering error informals which aren’t necessarily related to number of candidates. A linear relationship is a reasonable model to establish a relationship.
Van Badham must be having a competition with Heath Aston as to who can make the stupidest interventions on the subject of Senate electoral reform.
Your analysis clearly highlights the difficult voters have with getting their numbering right. But there’s a deeper problem, which I analysed in detail in my ERRN Working Paper “Optional Preferential Voting for the Australian Senate” (http://law.unimelb.edu.au/__data/assets/pdf_file/0020/1556012/WP_16_Maley3.pdf). It is that writing numbers is not the same as being able to have genuinely held preferences for the candidates. To put it bluntly, most below the line voters are forced to lie. Most of the candidates on a Senate ballot these days amount to nothing more than names, and their party names are nothing more than slogans. They don’t campaign, and it’s impossible to find out who they are or where they stand on issues which you as the voter might deem important. In addition, with 110 candidates (as in NSW in 2013) it would require 5995 pairwise comparisons to put them in a full preferential ordering. If every voter, in the polling booth (a) read the names of all the candidates on the ballot, and (b) tried to so order them, the electoral system would collapse.
Ultimately, people wind up trying to write consecutive or random numbers on the ballot just to make sure that their handful of genuine preferences get counted. In this regard the system treats them like the proverbial infinite number of monkeys, and the outcome would be no different if the AEC were empowered to fill in empty squares using a random number generator.
We have reached the point where compulsory full preferential voting makes a farce of the process, and satirises genuine deliberation.
I am involved in politics, and yet even I still made mistakes in my attempt to number 100+ boxes below the line, and had to go back for a replacement ballot paper ( I think at more than one election).
It should not be this tricky to direct your own preferences as a voter.
Reading this article makes me wonder if I’ve made other below the line errors without realising.
Hi Michael,
Yes I heard someone (I think it was you) make this point at the ERRN day at the ANU in 2014 – I had never thought about it before but it’s absolutely critical.
“democracy doesn’t get much easier then numbering 150 boxes.” She said that as a serious argument. Wow.
Have you been blocked by Van Badham yet Ben? She really doesn’t like having to actually debate people. She prefers shouting at them.
@Dan, I have been blocked by her, but not over this. Prior to the last few days I’ve never had any interest in reading her Twitter, never followed her, but I retweeted an article she didn’t like and she blocked everyone who retweeted it.
What was the article, out of curiosity?
Isn’t it time to get electronic (on-line) voting? The voter would be informed on the spot if the vote is formal or informal and can make the appropriate corrections.
Interesting, I’ve always voted below the line (though if I recall last time with ivote I was very lax in where my preferences went after the first 20 choices, and then it might have actually been somewhat important given the last minute animal justice election). I wonder how many times my vote has been informal.
Really though it should just be number 12 or more (not every box) below the line.
@Dan, it was about people disagreeing about whether to use the immigration system to keep out people that you disagree with.
@Andrew – iVote would’ve been NSW, which already has optional preferential below the line – much easier to do that.
@Herman – electronic voting won’t really help. Even if you get informed if your vote is informal, the fact remains that numbering all the boxes still takes ages and involves you preferencing a whole bunch of people who you have never heard of – basically making up a nonexistent preference. As Michael said above, “writing numbers is not the same as being able to have genuinely held preferences for the candidates”.
I’m another person who always votes below the line.
Every election I spend at least 12 hours researching the parties and candidates so that I can rank the candidates based on actual knowledge, and therefore express a genuine preference. I’m quite sure that 99.99% of voters would consider the exercise a massive waste of time (and they probably have a point) but at least I know that if my vote helps to elect a candidate I don’t particularly like, they will have beaten someone I liked even less.
But it is hard: even though I take a written voting plan in with me, I often make transcription errors and have to ask for a new paper. It also takes much much longer for me to vote than most people.
We need a system that makes voting as simple as possible, while leaving the expression of preferences in the hands of the voter. The system should not be subject to manipulation by parties, and not excluding of minority views that are supported by significant portions of the electorate.
And while I’m dreaming, I’d like a little steam-hauled train for my very own.
If below the line voting was easy, it wouldn’t need software assistance. I was only able to cast a below the line vote in 2013 by preparing a sample ballot beforehand on the website belowtheline.org.au, then copying the numbers onto the actual ballot paper.
Ben,
It was NSW so its optional, but there it actually was a close thing for that AJ spot. Informality wasn’t my issue, but rather that you actually need to make sure you DO preference.
Optional after 12 is less of an issue in a typical Senate race with the big quotas. I’m sure someone here will know the exact numbers better, but by fully preferencing Green, Labor and your favourite single issue left parties your vote probably wont go past their full lists before it is between them and a right party so preferencing every other party then working your way though right parties seems a lot to expect.
That’s true. Also there’ll be a lot less candidates in each group and less groups than a NSW ballot so 12 numbers would cover a much bigger proportion of the ballot than 15 numbers on a NSW LC ballot.
This article is misleading in several ways. Two examples:
The chart of BTL versus number of candidates is massively misleading. Here’s the chart with the states and territories coloured: https://imgur.com/UPDP3eF You can see the correlation is as low as r=0.03 and most slopes are basically flat in terms of percentage. It shows that the BTL rate is based on the state/territory not the number of candidates. The BTL rate for 6% can vary wildly between territories. The BTL rate for >30 candidates is steady at 10% with massively high rates of vote exhaustion among minor party voters (up to 85% of votes lost). Due to voters not realising the need to specify many more preferences than the number of candidates (in order for their vote to count for people they prefer and against people they don’t prefer). This is far higher than the 3% rate in the federal Senate. HoR informal rate is 6% despite there usually only being <10 candidates. Massive voter education is needed if changes are introduced at the last minute or many people’s voting power will be lost due to exhaustion and other errors.
Somehow my previous comment didn’t post properly…the middle got cut out. Here is part 1:
The chart of BTL versus number of candidates is completely misleading. Here’s a chart with the states and territories coloured: https://imgur.com/UPDP3eF You can see the correlation is as low as r=0.03 and most slopes are basically flat in terms of percentage. It shows that the BTL rate is based on the state/territory not the number of candidates. The BTL rate for 6% can vary wildly between territories. The BTL rate for >30 candidates is steady <6% even if the number of candidates doubles.
Here is part 2:
Also, most of the informal BTL votes are people who just put [1] below the line with no preferences, and these BTL votes will remain informal even when GVTs are eliminated. With optional/partial preferential voting, the rate of unused votes easily ends up as double-digits >10% with massively high rates of vote exhaustion among minor party voters (up to 85% of votes lost). Due to voters not realising the need to specify many more preferences than the number of candidates. This is far higher than the 3% rate in the federal Senate. HoR informal rate is 6% despite there usually only being <10 candidates. Massive voter education is needed if changes are introduced at the last minute or many people’s voting power will be lost due to exhaustion and other errors.
I’m working on the assumption that a savings provision will mean a ‘1’ below the line will count as a formal vote – as it should. I am fairly confident that is being proposed.
Thanks for the data on state breakdowns – I hadn’t seen that. I still think it is relevant to look at the whole country – do you really think it’s a coincidence that the smaller states with smaller candidate fields have the higher BTL rates (outside of Tas and ACT which have other explanations)?
We don’t know how many voters will exhaust, but if the ballot (and HTVs) require six preferences then you would expect to see a lot more preferences flowing.
I agree on the need for education but ultimately if a voter doesn’t wish to direct preferences I don’t see the problem – although if exhaustion is high we may need to consider a different counting method.
Provided that people know that they have the right to extend preferences as far as they like, I’ve never been able to follow the argument that vote exhaustion is a problem. For reasons spelt out in my earlier comment, I’m genuinely indifferent between the great majority of Senate candidates, because with the best will in the world I can’t find out a damn thing about them: who they are, what they stand for, and how they might behave if elected. That being the case, it makes good sense that my vote should exhaust when I’m out of genuine preferences, and forcing me to write spurious numbers on my ballot and then using them to transfer my vote to candidates I’ve not really chosen adds nothing, to the overall legitimacy of the election process.
Hi Ben, how you can assume a lone [1] will count below the line? I am very interested in further analysis if it’s been proposed…please advise if you know who’s proposing it. I’ve never heard it, and it’s the opposite of the JSCEM recommendation (even tho we’ve moved on from that). A savings provision only applies to the law as it currently stands, i.e. lone [1] is informal, so a “savings provision” is the opposite of what’s needed to make those ballots count.
The issue of minor/micro party voters not directing preferences is a massive problem, because it means vast numbers of votes may exhaust (millions, if scaled up from the states), which means their votes can become abstentions and they don’t count toward the result. This fails the intention of voters who wanted to count for alternative parties at the expense of major parties. The risk is compounded by misconceptions surrounding “I don’t want my vote every going to a major party”—without realising that expressing a preference for winnable least-worst party is how your vote can count against a winnable most-worst party instead of ceding the result. Basically replacing GVTs with exhausted votes at the last minute, is swapping one failure for another, and the least savvy voters are going to get caught out the most.
It’s true that some voters are happy to abstain, but we’re talking about most of a quota’s worth of votes that can be lost unintentionally. With only six preferences below the line, we can expect a vastly higher rates of exhaustion: final seats are often decided on 40th, 50th, 60th preference GVTs after hundreds of rounds of counting (well, NSW might benefit from a smaller number of sham parties without GVT, but in WA most of our microparties are ‘legit’, so we can’t expect the number of parties and candidates to fall unless we lose genuine choice and opportunity). If exhaustion is high, it’s extremely difficult to choose a counting method that can deliver a good outcome (if the preferences aren’t there, they aren’t there no matter how you count). Six preference above the line is safer, because it counts for 20-30 candidates, but the more the better, so that your vote actually counts against the people you don’t want. So voters really need to be educated to put as many preferences as often as possible.
As you can see from the state-by-state breakdown, you can’t draw a line though the whole country for BTL vs Candidates. The rate stratifies for each state and the length of the ballot paper is hardly related to the BTL rate. It appears that local factors matter more. In WA (where I am) the BTL rate can vary from 1%-25% within an election, but from election-to-election our BTL rate did not change from 40 candidates to 77, in fact it went up. You can conclude that large (>40 candidates) are associated with lower rates of BTL and small (<30 candidates) are associated with higher-ish rates of BTL, but not that it is due to the amount of unwieldy numbering.
I’m not that concerned about exhaustions. I think the instructions on the ballot to number 1-6 above the line will mean most of those who vote for small parties will number 1-6 above the line. I would expect less groups, so a ballot for 1-6 will go a decent distance – and for a lot of those voters I would expect the Greens, Labor or Coalition would get into their top six.
A “savings provision” doesn’t necessarily refer to the law now – it’s just a provision which says certain kinds of votes are formal even if they violate the ballot paper instructions.
I’ve been briefed on parts of the law and they definitely include a savings provision. I would assume this would cover both above and below the line.
You say these voters “wanted to count for alternative parties at the expense of major parties” but there is absolutely no evidence for that.
What we need is to start off with SIMPLE reform. Allow voters to number all the boxes above the line as an additional new option and you would go from 150 in extreme examples to < 50 boxes (but I think most areas would have more like 20-30 boxes above the line) and see how that goes.
I bet a lot more would use it.
Ben, re “wanted to count for alternative parties at the expense of major parties”.
Many of us voters want to say democracy is important, we want minor parties in the Senate (any minor party but we have our preference) and want to support all the micro’s against the corrupt career politicians in Labor/Liberal/Green. Most Micro Party GVT reflect this.
Under the new system you’ve removed options instead of just adding an additional ‘1-6’ option, at least in Victoria they have both ‘vote 1’ GVT plus ‘vote 1-5’ above the line choices.
If you did what you propose, the non-transparent, misleading and corrupting GVTs would still be by far the easiest option.
I just don’t believe that most microparty voters would rank any micro party ahead of the major parties or the Greens. It’s in the strategic interest of the parties to do deals but I see no evidence, when voters are asked to mark their own preferences, that they follow such a strategy.
In Victoria you can’t number multiple boxes above the line.
Actually if voters were informed on how corrupt the majors were, about how they are trying to limit democracy to their parties, how they are trying to exhaust their votes like they do in NSW, how if they vote for a major the majors get $5+ per voter, yet the minors get $0 per voter, then they would indeed vote for all minor parties.
Imagine if on the ballot it said “If you vote for a party who gets 4%, they will get $5 of your taxes, minor parties will get $0”, how many people would think that’s unfair and protest vote by putting a minor first or do themselves a favour and put a micro first, and a major 2nd or further down.
But it seems the majors only want the ‘transparency’ that benefits them.
They don’t know what voters would do given choices, your admit it yourself that if voters had the choice of “Just voting 1” they would, which indicates most voters don’t really care, and that probably is true, otherwise we wouldn’t have compulsory voting to force them to make a decision.
In which case if you’re going to force someone to vote, the same logic should be happy with forcing them not to throw away their vote with exhausted voting, but majors love exhausted voting because it benefits them the most.
If the majors agree about transparency then all electoral reform aught to be constitutional and given to the people to vote in a referrendum (either during or before an election).
The question can be, “Should we change to a system that experts believe will eliminate minor parties”. Yes/No.
At least then the voters can decide.
I think it’s patronising to think so little of voters – that they’re all being fooled.
Of course there isn’t perfect understanding of preferences, but I think voters have the right to not number preferences if they don’t want to. I don’t think it reflects a lack of understanding necessarily – at certain elections I have not preferenced when I knew it was pretty likely my vote would exhaust, and I know plenty about how elections work. I simply didn’t want to give my preference to any of the candidates.
It’s entirely different to forcing someone to vote – in order for someone’s perfectly valid and genuine choice to be counted, they need to make a bunch of other choices amongst candidates they don’t care about or don’t know, or we throw their vote out. This person may want to vote, but you’re threatening them with informality if they don’t vote for every candidate.
It won’t eliminate minor parties. It won’t eliminate the Greens, and in the past GVTs have been a killer for minor parties like the NDP and One Nation. What you mean is “micro parties” – those with a tiny vote who rely on confusion and luck to get elected.
There’s a rather odd comment in Lenore Taylor’s latest piece in The Guardian (http://www.theguardian.com/australia-news/2016/feb/19/senate-voting-reform-stirs-up-hornets-nest-between-likely-winners-and-losers): “Voters will be asked to vote for six parties above the line, after which no more preferences are allocated.”
Now maybe someone somewhere along the line has got the wrong end of the stick, but I can’t begin to imagine a justification in principle for limiting voters in the number of preferences they can choose to express above (or for that matter below) the line.
Unless Australia has decided that it wants to model its electoral system on that of Papua New Guinea.
I assume that was just confusion, I can’t imagine that would be in the bill.
Off topic – but just wanted to record the start of campaigning in the Murrumbidgee electorate in the ACT for the October election – canvassing call on behalf of one ALP candidate and a stall at the shopping centre for a different ALP candidate. Worth noting – no sitting ALP members in the Murrumbidgee electorate so the competition will be intense
I am a bit out of touch, but haven’t seen much recently showing a survey of what voters want to do. Back in the pre-1984 days there were surveys that showed the majority of the 10% Senate informals were from voters apparently trying to copy 50,60,70 numbers from a party HTV card but not getting it right. Maybe many voters would prefer to be able to follow party ticket simply. Mind you we still need to simplify the Senate ballot paper, asking voters to try to intelligently choose between 80-100 mostly unknown candidates is a completely meaningless waste of time as MM says.
I always vote below the line in the senate and I always have problems. I start vote high number for candidates that I don’t want, then low number for the candidates I do want. I think fill in teh gap often jumping around the ballot paper as I go which often leads to either double counting or missing a number. I then have to correct my ballot paper to ensure all numbers are included so the ballot paper is formal. All up about 20 minutes and at least two goes at it.
It’s couldn’t be more byzantine if the tried. But it’s the only way to make sure my vote is counted in the way i intended.
Sometimes it would be good if they recognised the right not to vote for some candidates.
@Shawn,
Here’s an example of a poll asking voters about it, even if the answers didn’t quite capture what the options are. Sure there’s no clear majority in support of change but there’s quite a lot of people who would like to see the model changed, plus a lot of votes for ‘don’t know’ or ‘something else’ – less than a third supported the status quo.
Michael Maley: 5995 pairwise comparisons are only needed if you use the naive method to sort the candidates. You can do considerably better, for example by picking a candidate likely to be around the midpoint of your preference as the “pivot” and sorting the candidates into two piles as either higher or lower preference than the pivot. You then sort each pile in the same way, by breaking them into smaller piles, and so on. This will generally require less than about 1000 comparisons to sort 110 candidates, depending on how well you choose your pivot candidates.
(I should add that this is of course mere nitpicking – clearly 1000 pairwise comparisons is still far beyond what can reasonably be expected of a voter!)
kme: As a matter of fact I had given some thought to whether some more efficient sorting algorithm such as the Quicksort one you describe might be applicable. But I note that in the worst case scenario (which I always tend to assume, being a pessimistic realist) it’s required number of comparisons is also O(n squared). In any case, as you note it’s a distinction of theoretical rather the practical interest, since voters are not computers, and we are still talking of a level of overall complexity way beyond what people could cope with in a polling place.
You only get the pathological O(n**2) behavior if you always choose pivot candidates that are at the extremes of each pile (least or most preferred). I would have thought it was easy enough to avoid that, at least for the larger piles (it doesn’t matter so much once you get down to the smaller ones).
kme: Maybe we should ask the AEC to put up posters at polling places advising voters how they might best apply optimal sorting algorithms 🙂
It’s a cunning plan to produce a nation of algorithmic experts.
The major deterrence for BTL voting is not the physical act of numbering 150 boxes correctly – although that is not an inconsiderable task – it is the requirement to make hundreds of preference decisions about parties about which one has not heard and which, with probability approaching 1, have no impact on the election.
I too do hours of exhastive (and exhausting) research on candidates and even then there are always a few for whom it is essentially impossible to discover any information. (I put these down to lost a bet/it was on my bucket list.)
BTL voting requires people to make marginal decisions with low information, or make random choices when trying to exercise their vote seriously. That is, I think, why people don’t like BTL, and statements from people that it’s just about writing 100+ numbers completely miss the point.
At the JSCEMm the ARC gave evidence that the BTL informal rate is quite low.
Why is that evidence so different from your result?
My evidence is based on a 2001 survey of all informal votes. As far as I know they haven’t done this again.
I haven’t seen this transcript but I can’t imagine how it could be close to being true.
In 2001 about 223,000 votes were informal due to below-the-line errors. There’s been no change to the system except there are now more candidates (making BTL voting harder). The idea that below-the-line informal votes have dropped 96% seems absurd.
There also hasn’t been any general decline in the informal vote, so the idea that below-the-line errors would drop from 47% to 2% is also absurd.
I also don’t know how the AEC could answer this question without having done a full survey, because I don’t believe their system records the type of informal vote.
Thanks, The evidence seemed completely counterintuitive to me. The URL (which I tried to include) is:
http://parlinfo.aph.gov.au/parlInfo/search/display/display.w3p;adv=yes;orderBy=customrank;page=0;query=parties%20Deakin%20Dataset%3Aconventions;rec=2;resCount=Default
I have emailed the AEC but at this stage I only have an acknowledgment.
Oops, I’ll find the right URL.
http://parlinfo.aph.gov.au/parlInfo/search/display/display.w3p;query=Id%3A%22committees%2Fcommjnt%2Fe9e7a7b1-a045-454d-b558-2a4df04b6718%2F0001%22
Comments are closed.