| Electorate | Margin | Electorate | Margin |
| Helensville | NAT 45.97% vs LAB | Papakura | NAT 31.59% vs LAB |
| Hunua | NAT 50.86% vs LAB | Rodney | NAT 31.01% vs CON |
| Northland | NAT 35.95% vs LAB | Whangarei | NAT 36.74% vs LAB |
 Local electorates
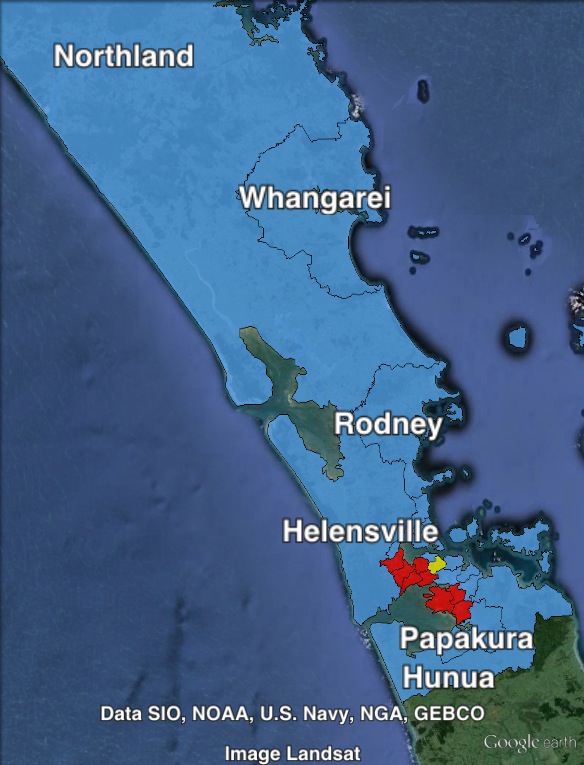
“Auckland Surrounds” covers the rural parts of Auckland Regional Council (both north and south of the Auckland urban area), as well as the Northland area to the north of Auckland.
There are six electorates in this area, four to the north of Auckland, and two to the south. All six are very safe National seats, with margins ranging from 31% in Rodney to 51% in Hunua.
To the south of Auckland you find Hunua and Papakura.
To the north of Auckland, you find Helensville, Rodney, Northland and Whangarei.
The Labour Party were the runner up in five out of these six electorates, although in all cases they were a long way behind. In Rodney, the Conservative Party came second.
Redistribution
Substantial changes were made to the electorates on the western and northern fringe of Auckland. Prior to the redistribution, the electorates of Waitakere, New Lynn and Helensville all overlapped between the urban area and the rural area, and for my purposes (and the results table below) all three electorates were counted as ‘Auckland Surrounds’.
In the redistribution, Waitakere was abolished, New Lynn contracted into the Auckland urban area, and Helensville lost its urban parts to the new seat of Upper Harbour. Helensville took over the rural areas previously included in Waitakere and New Lynn. These changes significantly increase the National vote and reduce the Labour vote.
Relatively minor changes were made to Hunua, Papakura and Rodney, and no changes were made to Northland and Whangarei.
Assessment
The Auckland Surrounds area is very favourable for the National Party, who poll more than twice the vote of Labour in the area. The National Party polled 12% higher than the nationwide average on the electorate vote, and 9% higher on the party vote. The Labour Party polled roughly two-thirds of its nationwide average. On the electorate vote, Labour did a lot worse – 20% compared to 35% nationally.
The Green Party polled 1.6% less on the party vote, but 1.1% more on the electorate vote. This could reflect the safe nature of the electorates in the area, which may mean Green voters don’t cast a tactical vote for another candidate.
New Zealand First polled above average in this area, 8% of the party vote compared to 6.6% nationally. The area was also a good area for the Conservative Party, polling 4.4% of the party vote compared to 2.7% nationally. The Conservative Party also did very well on the electorate vote (7%), mostly reflecting the fact that Rodney was the party’s main target at the 2011 election.
2011 election results
| Electorate Votes | Party Votes | |||||||
| Party | Votes | % | Swing | Redist | Votes | % | Swing | Redist |
| National | 150,434 | 56.61 | -1.84 | 59.84 | 145,937 | 53.38 | +0.87 | 56.27 |
| Labour | 68,970 | 25.95 | -1.97 | 20.03 | 61,430 | 22.47 | -4.97 | 18.16 |
| Green | 20,398 | 7.68 | +1.55 | 8.30 | 25,451 | 9.31 | +3.82 | 9.42 |
| New Zealand First | 6,111 | 2.30 | +0.59 | 3.14 | 20,404 | 7.46 | +2.94 | 8.08 |
| Conservative | 15,147 | 5.70 | +5.7 | 6.99 | 10,799 | 3.95 | +3.95 | 4.44 |
| ACT New Zealand | 1,900 | 0.71 | -2.59 | 0.79 | 3,530 | 1.29 | -4.08 | 1.39 |
| Māori | 484 | 0.18 | +0.18 | 0.24 | 1,482 | 0.54 | -0.24 | 0.57 |
| Legalise Cannabis | 993 | 0.37 | +0.37 | 0.14 | 1,343 | 0.49 | +0.1 | 0.51 |
| Mana | 933 | 0.35 | +0.35 | 0.35 | 1,335 | 0.49 | +0.49 | 0.52 |
| United Future | 1,203 | 0.44 | -0.33 | 0.46 | ||||
| Libertarianz | 152 | 0.06 | -0.02 | 0.06 | 202 | 0.07 | +0.03 | 0.07 |
| Democrats | 223 | 0.08 | -0.04 | 0.12 | 195 | 0.07 | +0.02 | 0.09 |
| Alliance | 77 | 0.03 | -0.04 | 0.03 | ||||
| Others | ||||||||
