Following on from the completion of the NSW draft boundaries map a fortnight ago, I have now finished the Google Earth maps of the new draft boundaries for the Victorian state redistribution.
Electoral maps have been posted for the Legislative Assembly and the Legislative Council. I’ve also updated the time-series map, which can be toggled to show the results for the 2002, 2006 and 2010 elections, to include the 2014 draft boundaries.
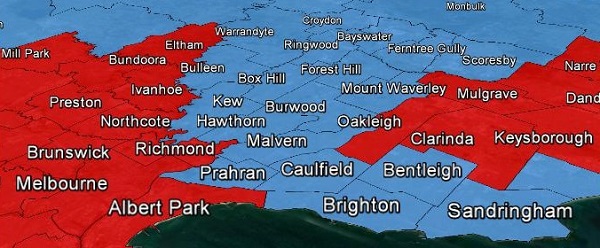
The draft boundaries have seen significant changes to electoral boundaries in northern and western Victoria. One seat was abolished in Eastern Metropolitan, with a second seat north of the river (Ivanhoe) shifted into the East Metro upper house region.
A seat was also abolished in Northern Victoria, with Yan Yean shifted from North Metro upper house region to make up for the abolition.
Two Western Metropolitan region seats were transferred into Northern Metropolitan region, with two new electorates created to make up the difference.
Numerous other seats were renamed or redrawn in different ways, but the two seats created in the west of the city, and the two seats abolished in the east of the city and in the north of the state, were the major shifts.
When you look at the statistics, it appears the Electoral Boundaries Commission has erred on the side of making less changes.
| Region | 2013 quotas | 2018 quotas |
| Eastern Metropolitan | 11.0641 | 10.6346 |
| Eastern Victoria | 11.0950 | 11.2220 |
| Northern Metropolitan | 10.8402 | 11.3532 |
| Northern Victoria | 11.0579 | 11.1974 |
| South-Eastern Metropolitan | 10.9054 | 10.6503 |
| Southern Metropolitan | 10.7620 | 10.3533 |
| Western Metropolitan | 11.1873 | 11.4729 |
| Western Victoria | 11.0881 | 11.1164 |
The Southern Metro and South East Metro regions have been drawn with substantially less than 11 quotas, despite a projected decline up to the 2018 election. Southern Metro in particular has been drawn with 10.76 quotas in 2013, and projected to cover only 10.35 quotas in 2018.
The Eastern and South Eastern regions are also projected to be more than one third of a quota short of eleven full quotas by 2018. Adding up these three regions on the south side of the river, and you are 1.36 quotas short of the full 33 quotas in 2018.
Meanwhile, Eastern Victoria, Northern Victoria, Western Victoria and Western Metro have been drawn with more than 11 quotas despite projected growth over the next five years. These four regions are already 0.43 quotas over the average, and this is projected to increase to over a full quota by 2018.
The Commissioners have sensibly drawn North Metro with less than a full 11 quotas. North Metro is projected to grow by over 40% of a quota by 2018.
Overall, the Victorian Commissioners have gone for an opposite approach to the NSW Commissioners – minimising changes at the cost of likely creating substantial variations from the average by the 2018 election.

Interesting. With two rock solid Labor seats (Pascoe Vale, Yuroke) moving from Western to Northern Metro and bumping on Labor’s two weakest seats in the region (Ivanhoe to Eastern Metro, Yan Yean to Northern Vic), it will make the Libs second seat in the region that much harder to achieve.
Daniel Andrews will be hoping for changes to the draft boundaries as it drastically cut his margin.
Great work but…
I cant access the files?
have logged into ‘box’ as a personal use account but it tells me
“The item you are trying to access has either been deleted or is unavailable to you.”
Sorry, the links were broken but they’ve been fixed now.
Love your work and well done on supplying these and website in general.
Any chance you can preview some more ‘interesting’ electorates?
Assume you are working up to a crescendo…
Hi Jason – no, I’m not working up to a crescendo. I started by previewing the most interesting electorates, and now we’re working through the final batches. But I will be doing other blogging that will focus on where the race will be most interesting.
The redrawing in the Latrobe valley is interesting – Moe has been shifted to Morwell, basically putting all the local Labor-friendly areas in that one electorate. Narracan (Lib) has blown out from 12.4% to 20.9%, while Morwell (Nat) has gone the other way, 16.3% down to 9.2%. Considering the embarrassing results Labor got in both seats in the last couple of elections, that makes Narracan probably unwinnable but Morwell a very good possibility if they can get their shit together.
Comments are closed.