ALP 6.8%
Incumbent MP
Carol Martin, since 2001.
Geography
Far north Western Australia. Kimberley covers the Broome, Derby-West Kimberley, Halls Creek and Wyndham-East Kimberley council areas. The seat includes the northern centres of Broome and Derby.
Redistribution
No change.
History
Kimberley has existed as a seat since 1904. The seat has been dominated by the ALP for most of the twentieth century, but Kimberley has never been a very safe seat.
The ALP won the seat off the Country Party in 1924. Two successive Labor MPs held the seat for the next 44 years. In 1968, the Liberal Party’s Alan Ridge won the seat.
In 1980, the Labor Party’s Ernie Bridge was elected. Bridge became the first Aboriginal cabinet minister in Australia in 1986, and served in the ministry until Labor lost power in 1993.
In 1996, Bridge resigned from the ALP, and ran for re-election as an independent. The ALP chose to not run a candidate against him and he won one more term before retiring in 2001.
The ALP’s Carol Martin won the seat back for Labor in 2001. She was re-elected in 2005 and 2008.
Candidates
- Rod Ogilvie (Independent)
- Craig Simons (Australian Christians)
- Jenny Bloom (Liberal)
- Michele Pucci (Nationals)
- Josie Farrar (Labor)
- Chris Maher (Greens)
Assessment
Kimberley’s 6.8% margin should normally be safe enough for Labor, but the loss of Carol Martin’s personal vote may endanger the seat for Labor if there is a big swing to the conservative parties.
2008 result
| Candidate | Party | Votes | % | Swing |
| Carol Martin | ALP | 4,066 | 41.2 | -1.0 |
| Ruth Webb-Smith | LIB | 2,566 | 26.0 | -8.9 |
| John McCourt | NAT | 1,809 | 18.3 | +18.3 |
| Annabelle Sandes | GRN | 1,320 | 13.4 | +0.1 |
| James Ockerby | CEC | 100 | 1.0 | +1.0 |
2008 two-candidate-preferred result
| Candidate | Party | Votes | % | Swing |
| Carol Martin | ALP | 5,587 | 56.8 | -0.1 |
| Ruth Webb-Smith | LIB | 4,257 | 43.2 | +0.1 |
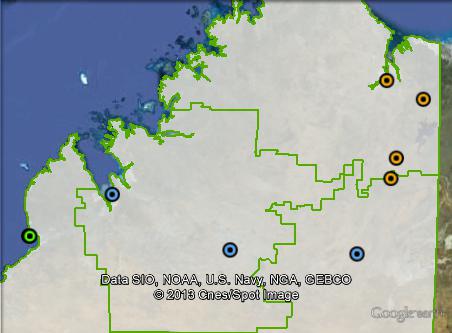
Booth breakdown
Booths have been divided into three parts. The two booths in the Broome area have been grouped together, and the remainder of the seat was divided into North and South.
The ALP came first in all three areas, varying from 44% in the south to 34.9% in Broome. The Liberals came second in all areas. The Nationals vote varied from 24.7% in the north to 18.3% in the south.
| Voter group | ALP % | LIB % | NAT % | GRN % | Total votes | % of votes |
| Broome | 34.93 | 24.76 | 20.76 | 18.15 | 3,570 | 36.20 |
| North | 41.17 | 25.09 | 24.67 | 8.49 | 1,885 | 19.12 |
| South | 44.21 | 26.29 | 18.26 | 10.69 | 1,468 | 14.89 |
| Other votes | 47.45 | 28.01 | 11.40 | 12.08 | 2,938 | 29.79 |


My prediction: Hard to pin down, depends on how much the Nationals’ northern popularity spreads up this way, and considering the small swing last time, there is potential for a large swing this time around.
I think either Labor or the Nationals will win here, not sure which.
Prediction: NAT Gain
The biggest issue in Kimberley is the proposed James Price Point gas hub – watch out for a big Green vote in Broome. Labor lost a big chunk of the Aboriginal vote at the NT election last year… I wonder if that’ll happen here, too. There’s a bunch of things going on here, it’s hard to pick.
The bullishness of the Nationals in the north plus the loss of Martin’s personal vote make it look like a Nat gain.