ALP 15.5%
Incumbent MP
Michael Atkinson, since 2002. Previously Member for Spence, 1989-2002.
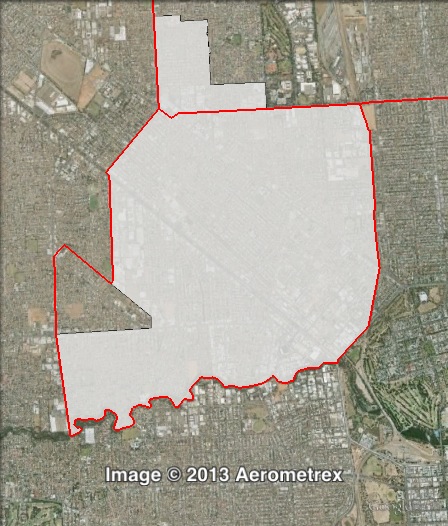
Geography
North-western Adelaide. Croydon covers suburbs immediately to the northwest of the Adelaide city centre, including Beverley, Brompton, Croydon, Croydon Park, Hindmarsh and parts of Flinders Park and Kilkenny.
Redistribution
Croydon shifted north, losing the balance of Findon to Cheltenham and gaining Woodville Gardens, parts of Ferryden Park and the balance of Kilkenny from Enfield. The ALP’s margin increased from 14.3% to 15.5%.
History
The electorate of Croydon has existed under its current name since the 2002 election, and was effectively a new name for the previous electorate of Spence, which had existed since 1970. Both Spence and Croydon have always been Labor-held.
Two successive Labor MPs held Spence from 1970 to 1989.
In 1989, Spence was won by Michael Atkinson. Atkinson has been re-elected in the area at the 1993, 1997, 2002, 2006 and 2010 elections, under the name of Croydon since 2002.
Atkinson served as Attorney-General from 2002 until the 2010 election, when he moved to the backbench. Atkinson has served as Speaker of the House of Assembly since 2013.
Candidates
Sitting Labor MP Michael Atkinson is running for re-election. The Liberal Party is running Glenda Noble. The Greens are running Natasha Henningsen. Family First are running NK Nkamba.
- Cherie Hoyle (Greens)
- Michael Atkinson (Labor)
- Glenda Noble (Liberal)
- Nkweto (NK) Nkamba (Family First)
Assessment
Croydon is a very safe Labor seat.
2010 result
| Candidate | Party | Votes | % | Swing |
| Michael Atkinson | ALP | 10,200 | 51.5 | -15.6 |
| Zack McLennan | LIB | 4,809 | 24.3 | +5.0 |
| James Hickey | GRN | 1,743 | 8.8 | -0.8 |
| Max Galanti | IND | 1,143 | 5.8 | +5.8 |
| Kat Nicholson | G4C | 726 | 3.7 | +3.7 |
| Alex Tennikoff | FF | 682 | 3.4 | +3.4 |
| Shaun Yates | DEM | 505 | 2.5 | -1.5 |
2010 two-party-preferred result
| Candidate | Party | Votes | % | Swing |
| Michael Atkinson | ALP | 12,741 | 64.3 | -12.0 |
| Zack McLennan | LIB | 7,067 | 35.7 | +12.0 |
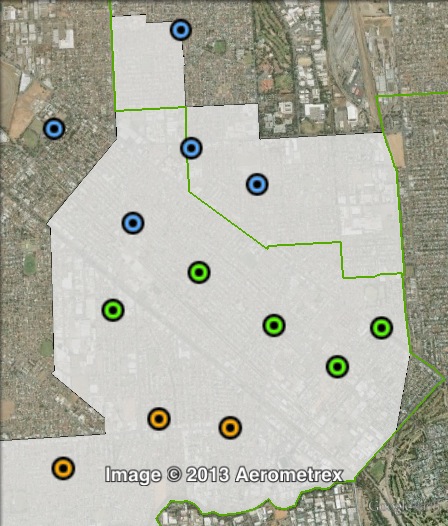
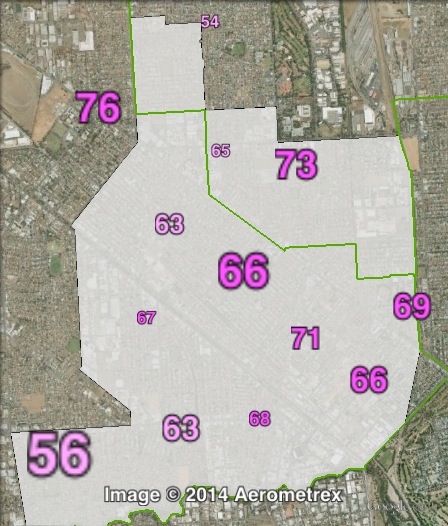
Booth breakdown
Booths have been divided into three areas: central, north and south.
The ALP won a majority in all three areas, ranging from 52.6% in the north to 67.5% in the centre of the electorate.
The Greens came third in the seat, with a vote ranging from 5.3% in the north to 11.4% in the centre.
| Voter group | GRN % | ALP 2PP % | Total votes | % of ordinary votes | |
| Central | 11.43 | 67.53 | 6,433 | 39.29 | |
| North | 5.29 | 52.62 | 5,314 | 32.45 | |
| South | 7.69 | 60.39 | 4,628 | 28.26 | |
| Other votes | 10.25 | 61.90 | 3,940 |
Mr. Raue, is that 76% LIB booth meant to be 76% ALP? It looks very out of place in relation to the rest of the seat.
Oops, you are right. That also means the numbers are off for the north of the seat. Will fix tonight.
Atkinson was one of the most conservative Attorney-Generals the state had ever seen. Shame that he is standing again. Also, another of the ‘religious’ right-wing members of the state ALP!
My prediction: Labor retain.