ALP 1.82%
Incumbent MP
Jo-Ann Miller, since 2000.
Geography
South-East Queensland. Bundamba covers the eastern Ipswich suburbs of Goodna, Redbank, Blackstone, Ebbw Vale, Riverview, Collingwood Park, Bellbird Park, Redbank Plains, Brookwater, Springfield Lakes and parts of Bundamba and Springfield. The seat covers the eastern parts of Ipswich local government area.
History
The seat of Bundamba existed from 1873 to 1912. The current seat was created in 1992, and has been held by the ALP for the last twenty years.
Bob Gibbs won the seat for the ALP in 1992. Gibbs had served as member for Wolston since 1977, and moved to Bundamba when his former seat was abolished.
Gibbs served as a minister in the Goss government from 1989 to 1996. He again served as a minister in the Beattie government from 1998 until his resignation from Parliament in 1999.
The seat was won by the ALP’s Jo-Ann Miller at a 2000 by-election. She has held the seat ever since, and served as a parliamentary secretary from 2001 to 2006.
Candidates
- Jo-Ann Miller (Labor)
- Ava Greenwood (Greens)
- Stephen Fenton (Liberal National)
- Luke Harris (Family First)
Assessment
While Labor holds Bundamba by a slim margin, they should have no trouble retaining the seat.
2012 election result
| Candidate | Party | Votes | % | Swing |
| Jo-Ann Miller | Labor | 10,945 | 38.93 | -22.39 |
| Michael Kitzelmann | Liberal National | 10,022 | 35.65 | +12.48 |
| Bernard Gaynor | Katter’s Australian | 2,461 | 8.75 | +8.75 |
| Angela Watson | Independent | 2,213 | 7.87 | +7.87 |
| Jim Prentice | Greens | 1,445 | 5.14 | -2.03 |
| Deborah Acason | Family First | 897 | 3.19 | +0.55 |
| Alf Viskers | Independent | 132 | 0.47 | +0.47 |
2012 two-party-preferred result
| Candidate | Party | Votes | % | Swing |
| Jo-Ann Miller | Labor | 12,354 | 51.82 | -19.41 |
| Michael Kitzelmann | Liberal National | 11,486 | 48.18 | +19.41 |
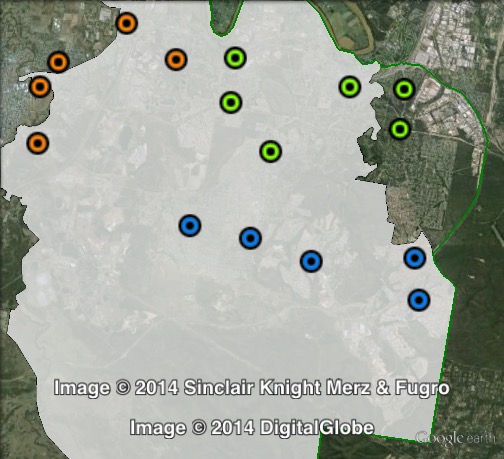
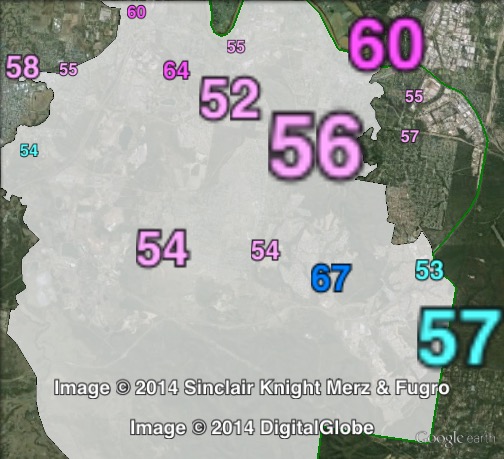
Booth breakdown
Booths in Bundamba have been divided into three parts: east, south and west.
The ALP won the two-party-preferred vote in the east (56%) and west (58%), while the LNP won in the south (55%).
Labor’s primary vote ranged from 34.6% in the south to 42.2% in the east and west.
The LNP primary vote ranged from 28% in the west to 42.6% in the south.
The Electoral Commission does not publish two-party-preferred figures by polling place, so two-party-preferred figures in the following table and map are estimates.
| Voter group | ALP prim % | LNP prim % | ALP 2PP % | Total | % of votes |
| East | 42.21 | 31.72 | 56.10 | 9,908 | 35.24 |
| South | 34.64 | 42.58 | 45.31 | 8,932 | 31.77 |
| West | 42.17 | 28.11 | 58.30 | 3,358 | 11.94 |
| Other votes | 38.08 | 36.03 | 51.15 | 5,917 | 21.05 |
An bad local mp, however the previous lnp candidate has just disappeared. I think the swing to labor will be in the order of 15%. areas like springfield lakes and augustine heights will hold well for the lnp, the rest will be safe labor, again.
My prediction: Easy ALP retain.
Unfortunately it was an easy Labor retain. I have lived for 6 years in the electorate and not once have I seen Miller step foot in my Suburb, the closest she came was sitting under a tree in the adjoining suburb. The Labor party would do well to replace the member with someone who cares about the whole electorate and represents all of us, not just one corner of the electorate.