LNP 26.01%
Incumbent MP
Steve Dickson, since 2009. Previously Member for Kawana 2006-2009.
Geography
Sunshine Coast. Buderim covers the central Sunshine Coast suburbs of Buderim, Mountain Creek, Kunda Park, Kuluin, Rosemount and Diddillibah.
History
The seat of Buderim was created at the 2009 state election, taking in parts of Kawana and Maroochydore.
The seat of Kawana had been created at the 2001 election, and was held from 2001 to 2006 by Chris Cummins of the ALP, who defeating the sitting Liberal MP for Mooloolah in 2001.
Cummins was defeated in 2006 by Liberal candidate Steve Dickson.
In 2009, Dickson moved to the new seat of Buderim, and won another term in 2012.
Dickson has served as a minister in the Newman government since the 2012 election.
Candidates
- Elaine Hughes (Labor)
- Sue Etheridge (Greens)
- Tess Lazarus (Palmer United)
- Steve Dickson (Liberal National)
Assessment
Buderim is a safe LNP seat.
2012 election result
| Candidate | Party | Votes | % | Swing |
| Steve Dickson | Liberal National | 16,056 | 62.17 | +5.15 |
| Chris Moore | Labor | 4,181 | 16.19 | -13.26 |
| Susan Etheridge | Greens | 2,749 | 10.64 | +2.39 |
| Lynette Bishop | Katter’s Australian | 2,003 | 7.76 | +7.76 |
| Tony Moore | Family First | 838 | 3.24 | +0.81 |
2012 two-party-preferred result
| Candidate | Party | Votes | % | Swing |
| Steve Dickson | Liberal National | 17,329 | 76.01 | +11.73 |
| Chris Moore | Labor | 5,469 | 23.99 | -11.73 |
Booth breakdown
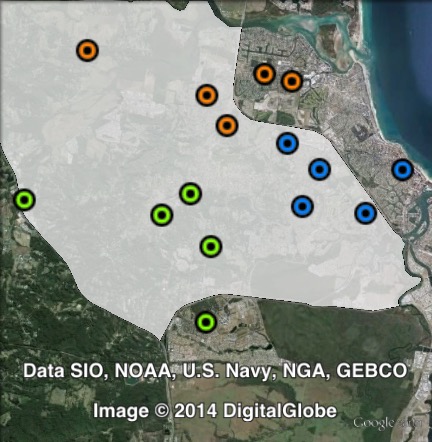
Booths in Buderim have been split into three parts: east, north and south.
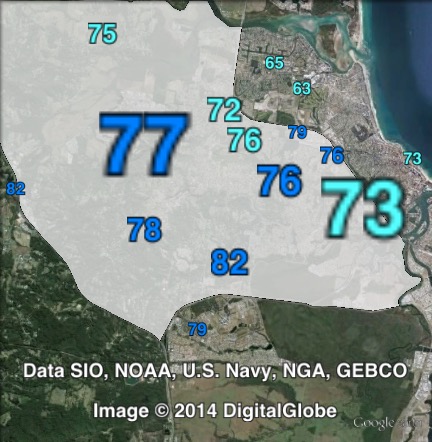
The Liberal National Party won a majority of the primary vote and a large majority of the two-party-preferred vote in all three areas. The LNP primary vote ranged from 55.7% in the north to 65% in the south. The LNP two-party-preferred vote ranged from 72.5% in the north to 78.6% in the south.
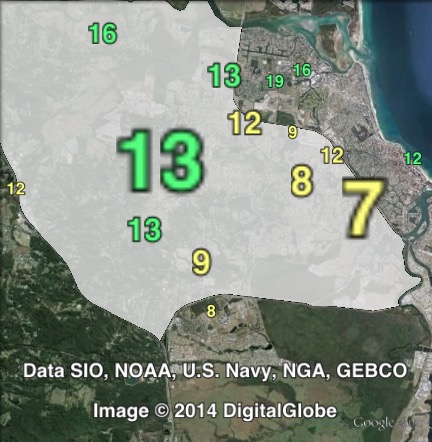
The Labor primary vote ranged from 13.9% in the south to 17.9% in the east. The Greens vote ranged from 8.5% in the east to 13.9% in the north.
The Electoral Commission does not publish two-party-preferred figures by polling place, so two-party-preferred figures in the following table and map are estimates.
| Voter group | LNP prim % | ALP prim % | GRN prim % | LNP 2PP % | Total | % of votes |
| South | 65.03 | 13.95 | 11.54 | 78.58 | 7,212 | 27.92 |
| East | 62.10 | 17.90 | 8.47 | 74.97 | 6,596 | 25.54 |
| North | 55.72 | 17.11 | 13.91 | 72.51 | 4,442 | 17.20 |
| Other votes | 63.28 | 16.29 | 9.77 | 76.45 | 7,577 | 29.34 |
Elaine Hughes is the Labor candidate
http://www.sunshinecoastdaily.com.au/news/gissane-hughes-for-alp/2507478/
My prediction: Easy LNP retain.