
When I went to look at the Voice referendum results at the booth level in my local area, I noticed some surprising trends in terms of which booths voted Yes.
In Parramatta, I was surprised that the north-east of the seat generally voted No, while more suburban areas in the west tended to vote Yes, particularly around Westmead and Wentworthville.
This map shows the booth results in the seat of Parramatta.
Overall, No won in Parramatta, but Yes won booths in a strip from North Parramatta to Wentworthville.
One possible explanation for this trend is the presence of voters of Indian heritage.
The Parramatta area is generally very diverse, but in particular has a large population of people of Indian ancestry. In the suburb of Parramatta itself, there are more people born in India than in Australia. But they are not evenly distributed. The north-east of the council tends to have fewer residents of Indian heritage, and has a larger Chinese-Australian community.
So I decided to look across the board. Is there a reason to think that, amongst voters in multicultural outer suburban areas, Indian-Australian voters were relatively likely to vote Yes?
Of course the Yes campaign received its strongest support in inner suburban areas – seats with high education levels and relatively well off. These areas have plenty of ethnic diversity (compared to rural areas) but not as much as areas deeper into suburbia. None of the highest-ranked Indian-Australian areas are in the inner city.
I don’t believe that Indian-Australian heritage is the primary cause of the Yes vote, so if you want to identify a trend you’d need to isolate the strongest Yes-voting areas, and instead look at the more marginal suburban areas that mostly ended up favouring No, but include some patches of Yes support.
I built a dataset merging the election-day booth results at the suburb level (based on the address on the polling place list) and filtering it to exclude suburbs with less than 500 formal votes. I then matched these suburbs up to the census ancestry data from the 2021 census.
First up, I’ve made a list of the 15 suburbs with the highest levels of Indian ancestry.
Ten out of fifteen suburbs voted Yes, a number of them by a significant margin. No suburb registered a vote less than 45.8%, which is at least 6% better than the national total.
Incidentally as a comparison I ran the same analysis on suburbs with a high level of Chinese ancestry. Twelve out of fifteen suburbs voted No, although most had Yes polling above the national result.
As another way to isolate any confounding effects, I thought it would be interesting to look at trends within a seat. So the next chart looks at the nine seats with the highest level of Indian ancestry, and plots the relative Yes vote for each suburb within that seat.
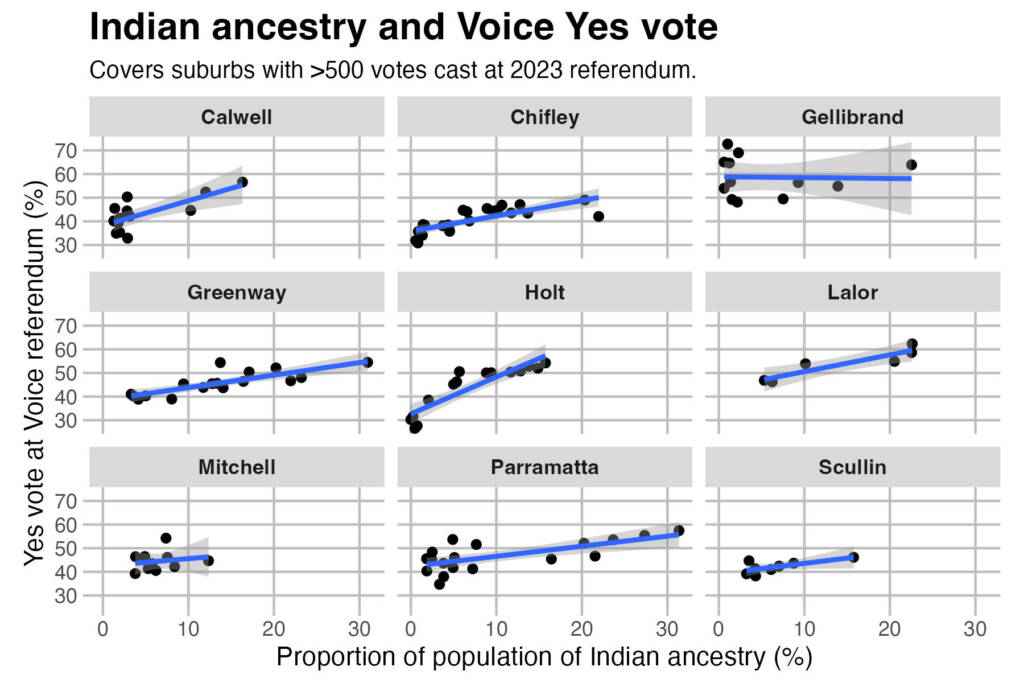
The trends aren’t all the same, but they are mostly in the same direction. Greenway, Holt and Parramatta in particular stand out.
I found the Gellibrand example interesting. There’s a cluster of booths with very low levels of Indian ancestry, which include the suburbs with the highest and lowest Yes vote. But once you leave that cluster, the booths with higher levels of Indian ancestry have a higher Yes vote.
So I also decided to map Gellibrand. This seat straddles the inner city Yes heartland, and those booths mostly had a Yes vote in excess of 60%. The remainder of the seat is split between smaller Yes majorities and some No majorities, but the western edge of the electorate has a substantial Indian-Australian population, and some of those are the only other booths which had a Yes vote above 60%.
I have tried to zoom out and look at these trends at a broader level, but it’s harder to draw conclusions because there are so many suburbs with very small numbers of people of Indian ancestry. But I think this next chart is still interesting, which is limited to suburbs in metropolitan electorates.
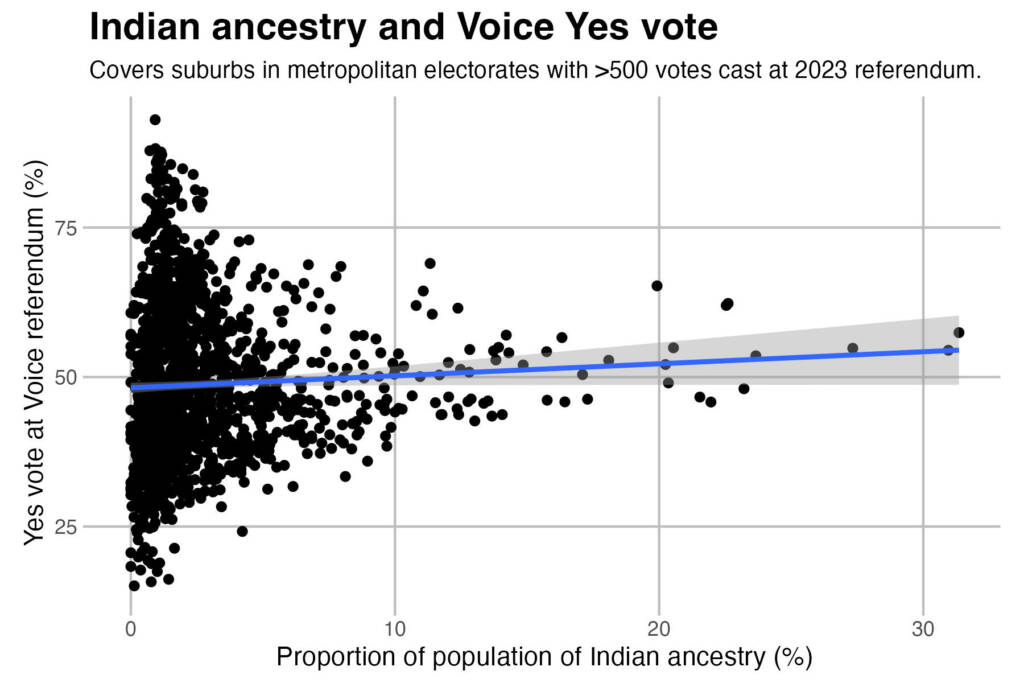
This trend line is quite shallow, but it’s interesting to see those dots with 10%+ ancestry. You can see that most of them voted Yes, and those voting No had slim majorities.
It’s always risky to try and draw conclusions from this sort of data – I’m always careful with the ecological fallacy. But I think there’s reason to think there’s something real here. I’ve generally focused on suburbs that have quite a high proportion of people in the group being analysed – I’m not trying to draw conclusions by comparing suburbs with a 4% Indian population with those with a 1% population.
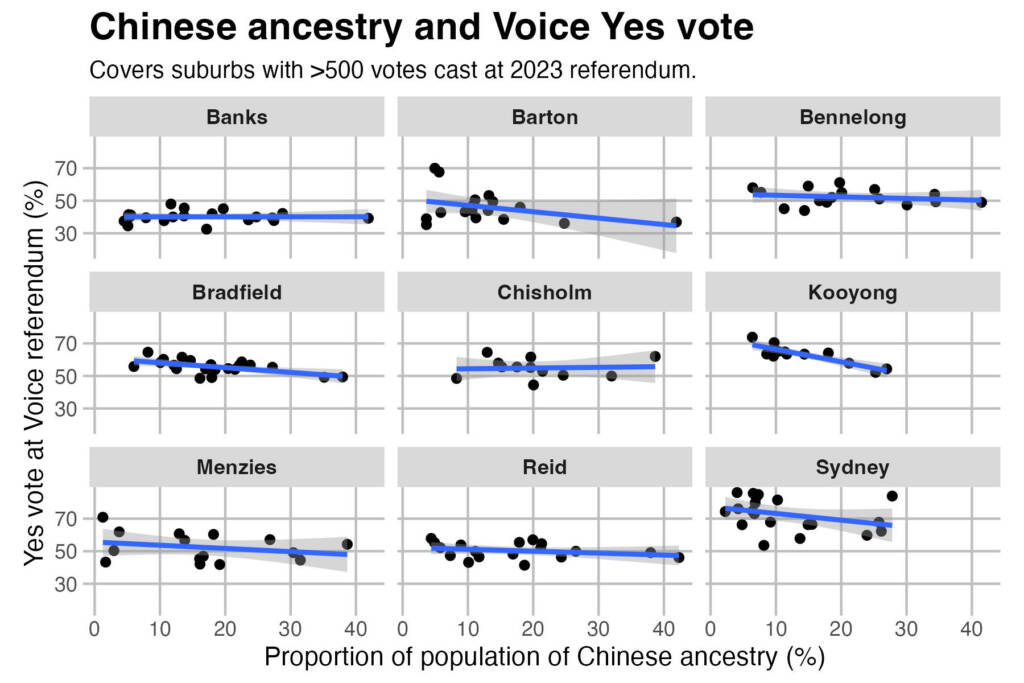
It gets more difficult to do this analysis for groups that make up smaller parts of the national population, particularly when they are spread around the country. But for the sake of completeness, I also performed the same analysis for Chinese-Australian populations. This next chart shows no trend in either direction in the nine seats with the most people of Chinese ancestry.
This next chart shows the top 15 suburbs for Chinese ancestry. Only three voted Yes, while most of the others had a Yes vote in the 40s. So they generally were more supportive of the referendum than the national average, but not by very much.

Hi
I gather that informal vites were low.
Are there figures for what percentage of the registered population did not vote?
You need to wait for the count to be finished before calculating that figure.
Good analysis Ben
Clyde North is 18.4% Indian and very strong YES vote compared to rest of La Trobe. Would that suburb or any in the Casey LGA come under the Top 15 for Indian ancestry?
https://profile.id.com.au/casey/ancestry?WebID=150
They may have been missed because of my methodology. I merged the voting data at the suburb level and only included suburbs with 500+ formal votes. For example, Harris Park is an extremely Indian suburb in Parramatta but I don’t think it has any booths in it, so it doesn’t appear on the list.
It looks like there are 3 booths in Clyde North and they all voted clearly Yes.
Actually I just checked and Clyde North has an Indian ancestry of 14.9% based on the ABS dataset I downloaded. Perhaps they’re not including “Not stated” in their percentage calculations.
It’s definitely a very Indian suburb, it makes the first page of the spreadsheet on my laptop, but not top 15.
I can add another suburb to your table. Glenwood in Greenway returned a slight yes majority but this is even more marked when you take into account local demographics – most of Glenwood has a high Indian population (thanks to the presence of a Sikh temple in the suburb), but one small part of Glenwood has a high Chinese-Australian population. The three booths in the Indian dominated part of the suburb all returned yes vote averaging around 52-53% whilst the single booth in the Chinese area returned a 45% yes vote.
You mentioned The Ponds in Greenway, with a 48% yes vote, a predominately European suburb, however the neighbouring Stanhope Gardens, with a strong Indian population had a 55% yes vote.
So yes, the yes vote does appear to have resonated particularly in the Indian community. I wonder if that is right across the Indian community or was it a feature of the non-Hindu Indian community?
Would it be possible that there is some unpleasant cultural memory of the Indian caste system and that these people don’t want to see the poorest people suffering from an entrenched system of disadvantage?
Ironically, the Voice may have resulted in an Australian caste system of its own?
I, like many others perhaps, could only see ‘membership/entitlement’ issues of the newly voiced outweighing any perceived or actual benefits to Aboriginal people.
The strong yes votes in Parramatta, Chatswood and Epping and Macquarie Park were perhaps driven by young, uni-educated voters and apartment dwellers. Worth noting is the presence of large CBDs and business parks with big corporates and public service departments. Many of them openly support reconciliation causes, pride events, carbon neutrality etc.
There were strong yes votes in random places even in relatively low-income, multicultural areas such as Lakemba and Wiley Park (South Asian and/or Muslim communities) in NSW and Sunshine and St Albans in Vic.
Thanks Ben, much appreciated interesting point about Harris Park and some of the more densely populated suburbs around major transport hubs is that they will have a larger % of non citizens such as international students compared to the more suburban areas such as The Ponds or Manor Lakes.
“Ironically, the Voice may have resulted in an Australian caste system of its own?”
India does reserve seats in parliament for scheduled castes and scheduled tribes, so there could be some understanding of how something like this can be used.
I think that’s a pretty silly comment though, absolutely nothing about the Voice would be creating a “caste system”.
Ben, I am big admirer of your work so i respect your opinion in your area of expertise.
I have spent 35 years in public administration and dealt with Aboriginal communities throughout the eastern states and I can tell you that there already exists a system of ‘indigenous selection’ be it on the basis of clan, residency on country or clashes between emerging elders and existing elders.
An authentic Voice would have to sort out the real interests from the vested ones and establish some criteria for who gets a say and any benefits or statutory representations.
It may be a wider trend than just Indian communities but extend to many migrants from countries with a history of European colonisation. Would be interesting to know if voting patterns differed significantly between migrants from China compared to those from South-East Asia.
Like Ben, I can’t see the caste system in India having any impact on the vote. My suburb has a high Indian population, of all castes. The one unifying feature locally is they are predominately Sikhs. A more likely reason (and I’m not saying it is valid or even likely, just tossing in another possible reason) is that members of religious minorities from a country that, ahem, heavily promotes one religion above all others, may have a tendency to relate to the yes vote. Whether that’s the case or not would depend on the religious background of Indians in those areas that tended yes, and that’s something that might be testable from census information??? I should note that my suburb does not stand out from the local area in terms of the level of university education or other factors associated with a tendency to have voted yes. In fact several of the neighboring suburbs (which voted no) rate higher on those criteria.
Thanks Ben good analysis – I think there is something to a theory that those descended from the 1950’s or so generation of Australians had a high Yes vote, whilst Australians with a link back to the migration waves which have progressively built “modern Australia” were more likely to vote No. perhaps Indian ancestry is an exception.
@Votante – I have to disagree with your comment – there was not a strong yes vote in Chatswood relative to surrounding areas and to the 2022 election. Across most of North Sydney and Bradfield, it appears to me that the Yes vote was 5-10% ahead of the IND 2CP in 2022, whereas in Chatswood it was behind it. I was expecting Ben to find a correlation with high chinese ancestry and and higher No votes but he hasn;t found it generally. There seems to be one in Kooyong and if you squint hard, in Bradfield. I think you might find it in North Sydney Be, if you capture that in your list (it must only just be excluded)
The difficulty with the Indian vote in Queensland (particularly Rochedale, Rochedale South, Mansfield, Eight Mile Plains, Kuraby and Runcorn on the southside – based around the Sikh Temple at Eight Mile Plains) is that’s it’s also comingled with very strong Chinese and Taiwanese populations. Those six suburbs are split between three adjoining federal electorates.
On the northside there are clusters in Taigum, Banyo, Chermside and Lutwyche (Lilley and Petrie) but it’s nowhere near as concentrated as South Africans in North Lakes or Vietnamese around Darra.
Also the Woolgoolga booths in Page (probably the most concentrated Sikh area in Australia) returned a No vote in line with the rest of the electorate. However this may have more to do with the fact that Woolgoolga is one of the oldest Punjabi communities in Australia.
@John Walker – Informal votes were low because there were fewer ways of accidentally stuffing up the ballot. We had a few blank papers, a tiny number where someone had written their own personal commentary on the paper but not actually filled it in and one where the voter had added their signature…
The normal ways of casting an informal vote, generally not completing the paper to allow a preference to be transferred, weren’t relevant this time around and the savings provision allowed a few votes through that would have been challenged at a normal election.
It also made it a breeze for scrutineers. My booth, even though one bundle had an extra 10 votes and we had to recount, still got through 2,000 votes in just over an hour.
@ Votante
Agree with you regaling many low income multicultural suburbs voting YES or much better than state/national averages. I would also add suburbs such as Springvale, Noble Park, Dandenong and even Doveton!. There was a Broad meadows booth that votes Yes and one in Woodridge QLD. In Fowler, there was a YES booth in Cabramatta and the rest of the booths around Canley Vale/Cabrammatta were marginal while Abbotsbury had a 75% No vote despite it being much more European and affluent. It seems low income CALD communities could have been won over if there was a better targeted campaign. This is stark contrast to SSM survey.
@High Street, I do agree with you that in Chatswood, there was a weak-ish Yes vote compared to North Sydney and Bradfield electorates. However, they were definitely higher than at polling booths at other large ethnic Chinese centres such as Hurstville, Burwood and Eastwood. All three of them don’t have nearly as many public service departments and big corporates that Chatswood has.
The relationship between Chinese Australian ancestry percentage and No vote isn’t quite clear.
Remember, you must be an Australian citizen or a grandfathered British subject living in Australia before 1984 to vote in an election or referendum here. The thing is that most Chinese living in Australia wouldn’t be allowed to vote because China doesn’t allow dual citizenship.
India also doesn’t allow dual citizenship but they have a scheme called Overseas Citizenship of India (OCI) which allows most rights given to resident Indian citizens but not the right to vote or hold public office there. OCI could then be paired with Australian citizenship meaning such Indians can vote here.
@Nimalan. Good points about the diversity and randomness of Yes votes. There are random Yes-voting booths in Strong No, middle and outer suburban electorates and they can make you scratch your head. Merrylands South in McMahon voted 63% Yes.
In fact, pick any outer suburban electorate with a large population of people of Asian ancestry (including South Asian, but not Middle Eastern) e.g. Chifley, Greenway, Fowler, Werriwa, and you’ll find a yes-voting booth or two in a sea of No-voting booths.
I agree with the targeted campaigning bit but as for the same sex marriage survey, the question and proposed law was a lot simpler than the voice referendum. Add to that, there was a range of ethnic and religious organisations who threw their support for the Voice campaign.
Mark Yore, I agree with you on the situation seen on the Brisbane southside, but there is still one indicator that can help us make a comparison. Census data shows that while China is the most common foreign country of birth in most of those suburbs, India is the top for Kuraby and Underwood. And for both Moreton and Rankin, Kuraby is an island of majority yes vote (albeit narrow) in a sea of majority no-voting booths. It isn’t a smoking gun though, seeing as other suburbs like Pallara and Drewvale with India being the most common foreign country of birth voted no.
@ Votante
Agree with you i am not sure why there was little support among the Middle eastern community. The two most middle eastern seats would be Calwell/Blaxland and there were only slightly worse that their state average despite being quite low SES. I guess Cost of living would more of a priority in these seats. However, booth seats where better than Cook which is much wealthier. In McMahon the strongest No vote was in the Anglo areas of the Green Wedge and Penrith LGA rather than East of the Cumberland Highway which is more Non Europenan and had a better result for YES while Gresytanes is more Italian/Maltese.
https://www.tallyroom.com.au/53530#comment-794403
A smaller proportion of people of Indian and/or Chinese ancestry would indeed be Citizens or grandfathered “British Subjects” compared with the population as a whole, which means fewer Indian and Chinese ancestry voters.
Many immigrant populations in Australia would have higher proportions of people under 18 due to fewer older immigrants (age limits on immigration) and many have a higher birthrate than Australia as a whole.
The vast majority of born in Australia people of Indian and Chinese ancestry would be citizens, particularly those of voting age, due to Australia`s citizenship laws.
Not all immigrants of Indian and Chinese ancestry came from India and the PRC, with their anti-dual citizenship policies. Australia has also been a destination for immigration from Chinese and Indian diaspora communities, particularly from places in relatively near Australia (Hong Kong, Malaysia, Vietnam, Fiji, etc.) as well as Taiwanese immigrants (Taiwan permits dual citizenship).
Had the “British Subject” franchise not been cut off in 1984, there would be a lot more recent immigrant voters in Australia, including Indians, Hong Kongers and Malay-Chinese.
The One Child Policy will also have increased rates of PRC immigrant naturalisation rates.
https://www.tallyroom.com.au/53530#comment-794426
Yeah, that makes sense.
Ethnicity is not the only reason people vote a certain way.
@Wilson Kuraby and Underwood also have huge numbers of Muslim voters centred around the Kuraby Mosque. While many of them are descendants of immigrants from Pakistan, there’s also a swathe from other Arabic countries such as Iran and Iraq. If you draw a line from Woodridge to Robertson you not only cross significant cultural groups (including Taiwanese, Tongan, Samoan and Japanese) the variance in wealth is also significant. So it’s very hard to get a read on such diverse communities because it’s not a mono-cultural enclave like Western Sydney or even Sunnybank.
To my knowledge of the Chinese Community, most people from older generations (over 35) voted overwhelmingly against it for different reasons:
– PRC Chinese tend to vote against it due to their social conservatism so they oppose Western progressive policies
– Hongkongers and Taiwanese tended to vote against it due to their anti-communism given it might have been associated with the Cultural Revolution
– Malaysian Chinese voted against it because it was associated with the Bumiputera policy
The younger generations tended to vote Yes which might helped make the No vote percentage lower in the Chinese Community
– For Australian-born Chinese (and those who immigrated at a young age), most are heavily educated and want to disassociate with their parent’s conservatism and be more Westernized so they tend to adopt most liberal social views (Ironically might be more liberal than Anglos on many social issues)
– Most recent and younger Chinese Immigrants while mostly socially conservative but had voted Yes given many themselves faced racial prejudice so they believed voting Yes was convenient to show their solidarity plus a lot of them are also heavily educated.
@ Marh
Good points above. Interestingly, the HK Chinese are an older wave of migrants and often came in the years leading up to the handover especilaly in Manningham so they would be a higher % of children born in Australia to the HK born parents than from the Mainland. I am always interested to see what will happen to the ethnic Chinese from Indochina & East Timor who came as refugees and much less affluent albeit been in Australia for a longer period so a greater % of Australian born. Would those communities move out of Springvale towards Glen Waverlery or Knox for example.
I wondered if Greater Melbourne had managed to have Yes Vote and nevertheless the “Most Progressive Major City” seems true as I found many similar areas in Melbourne that voted Yes would had a No vote in other Major cities. I wonder if it has to do with the exodus of Conservatives especially to Queensland and influxes of Progressives from other states? I also wonder what is the history on how Queensland is very Conservative compared to Victoria even adjusting for regional distribution?
Marh, I believe historically Queensland was quite supportive in referendums. However, many of those were related to workers rights. Queensland, a state with a high proportion of those working in primary industries, is not one that will be supportive of social issues like the voice, as voters are more concerned about their work and financial status similar to those in the American Midwest who are indifferent or oppose social measures like abortion or gun control.
I believe Tasmania is also a state focused on primary industries, and historically it has been the state least supportive of constitutional change.
Marh, I believe it’s mostly due to Melbourne not having a white working class population compared to other cities in Australia. Even Sydney has a sizable white working class that drove the No vote in places such as Penrith and Camden LGAs. The social progressive migration from other states to the “leftist safe haven” plays a secondary role.
Yoh An, Queensland has had a social conservative, fiscally progressive/populist vibe ever since it separated from NSW.
Ian, there are actually pockets of large white working class areas in Melbourne and even is their no vote is less than those equivalent areas and conversely Brisbane inner city had a lower Yes vote compared to equivalent areas in Melbourne so regional social factors due play some roles.
For Yes/No votes, it isn’t really because but rather occupation so you see why the high Yes vote from educated professionals but not rich business owners evident from Vaulcause in Sydney, Toorak in Melbourne and Hamilton in Brisbane had voting booths that voted No
Marh, having another look at Poll Bludger you’re probably right. Although, regional Victoria’s No vote was identical to regional NSW.
Comments are closed.