
This isn’t the first time I’ve discussed the significant shift away from the Coalition in urban Australia, but in today’s post I wanted to zoom out a little and look at the historical perspective, and look at how much more polarised Australia has become between city and country since last Saturday’s election.
The Australian Electoral Commission classifies electorates into four categories: inner metropolitan, outer metropolitan, provincial and rural. These categories are not perfect but they have been using them for a long time, and can give you a sense of long-term shifts.
I believe that this new Labor government is proportionately the most metropolitan government Australia has seen in the last thirty years, and probably for quite a lot longer, while the Coalition has dropped from metropolitan seats making up about half its members to less than a third.
In yesterday’s post I demonstrated how the Coalition’s losses were mostly concentrated in inner metro electorates, spilling over into a few outer metro neighbouring seats, with just one loss in a provincial seat, and on current numbers a potential gain in rural Gilmore.
This graph shows this data over a longer time period, showing the numbers for the four geographic categories since 1993. I found this categorisation data back to 2001 and was able to stitch it together myself back to 1993.
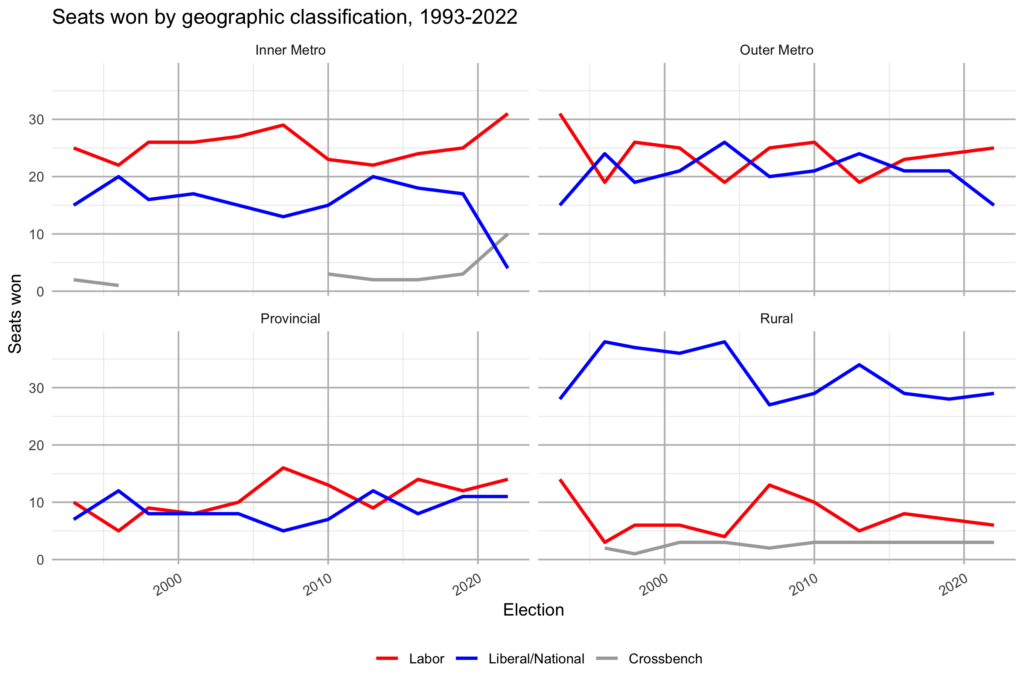
Labor now holds the largest number of inner metropolitan seats in the last thirty years, while their seat count in outer metropolitan Australia is roughly in line with the last Labor government and the 1998-2001 period, but not as strong as in 1993.
The more interesting story is in looking at the Coalition, had a relatively steady number of inner metro electorates until this year’s collapse, mostly at the hands of the crossbench.
The first crossbenchers elected in 1990 and 1993 were from inner metro seats (North Sydney and Wills), but from 1998 until 2010 crossbenchers were entirely present in rural electorates. The number of rural independents has remained steady at three at every election bar one since 2001.
There has also been a breakthrough in crossbenchers in outer metro Australia at this election, which doesn’t appear on the above chart. Nor do the two outer metro crossbenchers elected in 1996.
As a different perspective, I wanted to look at how many seats each of the major parties won in each part of the country as a proportion of their total seat count. For this case, I have collapsed the categories down into Metropolitan and Provincial & Rural. The metropolitan category makes up just under 60% of the entire country, with 87-90 metropolitan electorates at each election.
Assuming a Labor victory in Macnamara, 73.7% of Labor seats are in metropolitan areas. This is not a record. This proportion was higher in 1996, 1998, 2001, 2004 and 2013. This is a list of every Labor defeat in the last thirty years, barring the last two. Labor did particularly well in regional Australia in 2016 while Malcolm Turnbull did well in the cities. But this is the most metropolitan Labor party in government.
Indeed the story looks even more dramatic if you look at Labor's results in just rural seats, since they do quite well in the Hunter, Illawarra and Geelong. Labor won 14 rural seats in 1993, 13 in 2007 and 10 in 2010. They're now on track for just 6-7 rural seats in 2022.
The Coalition has been a majority metropolitan party just at three elections in the last three decades, and they won government just once in that time. They were narrowly a majority-metro party in 2007 and 2010, and were 51.3% metropolitan under Malcolm Turnbull in 2016.
Assuming that the Coalition wins Gilmore and retains Deakin, they will be left with a parliamentary membership which is two thirds provincial and rural.
What does this mean for the future? Well, I think this has implications for the Coalition's paths back to power. They don't have much room to grow in rural Australia, and any path back to power will have to involve winning more support in urban seats, if not the "teal" inner city seats where they were beaten so badly this year.
Barnaby Joyce can crow about the success of the Nationals in holding their ground, but they can never win government on their own - the power of the Nationals depends on their ability to form alliances with urban conservatives to form a majority, and right now the options in urban seats don't look great for the Coalition. But that will be something I focus on, coming up soon.
Finally, enjoy this big chart showing the results of the first chart more clearly. It was a bit too big to present up front.

i think based on this years election and inner metro with the teals (blue with green) the outer metro regions will see this and what various seats and groups have done to get these results and look to upset the the labor strongholds of outer metro seats like hawke and gorton and mcewen in melb and chifley, MACQUARIE, lindsay in nsw and have a similar group to the teals that we may call (the browns)(red with green)to give a local grassroots campaign like INDI and kooyong and warringah and see it happen across the country except for maybe w.a. because a lot of seats are seeing a shift away from labor and liberals and the greens are picking up more votes in outer metro and maybe at the 2025 federal election we may see a new type of parliament where we have a small labor and a small liberal and a seperate nationals all needing to work together to get bills passed i see labor with maybe 65 seats and so the libs/nats splitting as the nats will gain more seats on the edge of metro in the provincial areas and making alliances on the per bill basis rather than on the will of the coalition as the greens will pick up more seats to say 5-7 seats which would mean that no matter who has the most seats won they will need to work with a diverse cross bench
I think that these figures would be interesting if you take Qld out of the picture, since most of the ALP rural/regional losses have been in Qld. I am not quite sure just what is going on, but it is not as simple as regional/urban.
Apart from Gilmore and Robertson, I don’t think any non-capital city seat changed hands at this election. It has been ages since so few regional seats have flipped at an election.
Federal Labor still has a Queensland problem like they did in 2019 and prior. Peter Dutton, as a conservative Queenslander, may make the LNP real competitive and help sandbag regional Queensland seats.
Since Labor and LNP hardly ever defeat sitting Greens or independent MPs, I expect the Labor and Liberal parties to put more effort and contest harder in the middle class suburbs of capital cities.
Three cornered contests could occur in Brisbane, Griffith and Ryan in QLD.
Queensland is the last state the LNP needs to be more competitive in!
I think this is the first time Labor is in government without any seats in Regional QLD. They did not win seats such as Capricornia, Flynn and Leichardt. It seems Page has drifted away from Labor. Labor has not held any regional SA or WA seats since the 1990s. However, Labor did get a thumping result in Corangamite and Eden Monaro. It also got relatively good result in Monash and maybe they will have a long term eye on the seat. Also Dutton as leader will likely make it harder for LNP to win Inner Brisbane seats lost to the Greens back. It may also be the case that a Teal may try and take Moncrieff from the LNP. However, i feel Dutton may try and take Lyons which they narrowly missed out.
The LNP at the next election will need to chase votes outside QLD whilst defending their huge bag of QLD seats if they want to form government. 21 of their seats or over 1/3 are from QLD. There are no ultra-marginal Labor seats in QLD so they might as well focus outward whilst defending as many of what they have and I suspect they wouldn’t mind sacrificing some to gain more non-QLD seats.
Looking at the electoral map, Sturt, Moore (both scraped in with 51% to 52% of 2PP) are two rare examples of the LNP’s stereotypical, affluent, blue-ribbon seats aka Liberal heartland. Sturt is next to Adelaide and is the only LNP-held seat that’s next to a capital city CBD seat.
What were the 5 rural seats Labor held when it was defeated in 2013 ?
Blair, Hunter, McEwen, Richmond, Lingiari.
The categories are damn strange – Casey and Flinders are classified rural …..
– Hey Roy, has it got a farm?
– Yeah, 2 or 3
– Lets call it rural then
Thanks for that. I just managed to find the page on the AEC website under division classifications. Apparently Wakefield was also classified as rural in 2013. I noticed that some of the classifications changed over time. I agree that some of the classifications are very strange.
I’ve seen people claim on twitter that Labor has it’s lowest primary vote since 1934 which I don’t believe (although please correct me if wrong), I don’t believe elections like 2013,1996,1975,1977 and 1966 had better primary votes for Labor, surely not.
I can buy the coalitions being the lowest. But I would think it would have been pretty close to 1983 and 1946.
It is clear this is the highest green primary ever however.
It is the lowest primary vote for both Labor and the Coalition post-WW2. And yes, 1934 is accurate as the last date with a lower primary (with a split in Lang Labor).
It’s also not quite clear if this has edged out 2010 for the highest Greens primary (HoR). Currently at 11.8%, versus 11.76% in 2010.
Daniel
Labor’s primary vote in big Coalition win years:
1966: 40.0%
1975: 42.8%
1977: 39.6%
1996: 38.8%
2013: 33.4%
Labor may have won office but their primary vote is sick. The Teals may have won Liberal seats but they have hollowed out Labor votes – in Warringah, Mackellar and Kooyong – Labors pv is well under 10% – in Goldstein and Wentworth – between 10 and 11% – even Herbert a seat they held between 2016 and 2019 – their primary vote is 21.9%!! The Coalition might have a lot fewer seats but their primary vote is stronger across the board and is only really low in seats like Melbourne, Cooper or Grayndler.
Daniel, you know you can check these things, right? Wikipedia has the results for those elections. Even in 1966 and 1977 Labor polled over 39%.
Indeed I wrote a blog post!a few days ago with a chart showing that history.
1 thing to take note of as well is population and the amount of seats at the time so to have as such a small primary vote for all says a lot more people are moving away in droves
Finally got around to reading this. I see this year there was a net loss of 2 outer metro seats and a net gain of 2 provincial seats. Anyone know what these were? I assume the replacement of Stirling with Hawke simply exchanged one outer metro seat for another
Comments are closed.