ALP 14.7%
Incumbent MP
Jack Snelling, since 1997.
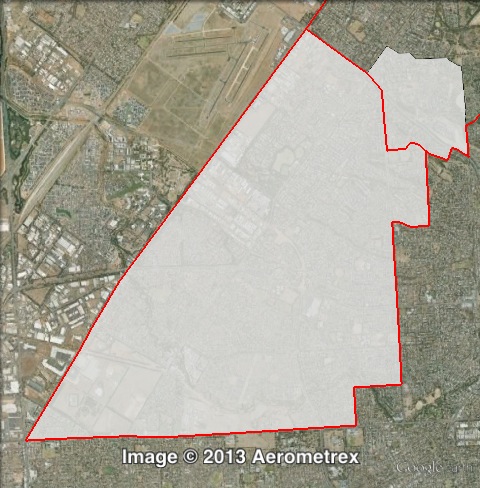
Geography
Northern Adelaide. Playford covers the suburbs of Ingle Farm, Para Hills West, Walkley Heights and parts of Gepps Cross, Gulfview Heights, Northfield, Para Hills, Para Vista, Pooraka and Valley View.
Redistribution
Playford expanded north into Gulfview Heights, gaining territory from Wright. The ALP’s margin was cut from 16.2% to 14.7%.
History
The electorate of Playford has existed since 1970, and has always been held by the ALP.
Terence McRae won Playford in 1970. He served as Speaker of the House of Assembly from 1982 to 1986, and retired in 1989.
John Quirke, also of the ALP, won Playford in 1989. Quirke was re-elected in 1993, and retired at the 1997 election to take up a seat as a Senator. He served in the Senate until 2000.
Jack Snelling has held Playford since 1997. Snelling served as Speaker from 2006 to 2010. Since the 2010 he has served as a minister, including as Treasurer since 2011.
Candidates
Sitting Labor MP Jack Snelling is running for re-election. The Liberal Party is running Michael Santagata. The Greens are running Danny Carroll. Family First are running Greg Evitts.
- Greg Evitts (Family First)
- Jack Snelling (Labor)
- Michael Santagata (Liberal)
- Danny Carroll (Greens)
Assessment
Playford is a very safe Labor seat.
2010 result
| Candidate | Party | Votes | % | Swing |
| Jack Snelling | ALP | 11,292 | 54.5 | -9.5 |
| Kerry Faggotter | LIB | 5,892 | 28.4 | +9.3 |
| Steve Ambler | FF | 1,349 | 6.5 | -1.7 |
| Dion Ashenden | GRN | 1,116 | 5.4 | +0.4 |
| Frank Feldmann | FREE | 647 | 3.1 | +3.1 |
| Andrew Woon | DEM | 435 | 2.1 | -1.6 |
2010 two-party-preferred result
| Candidate | Party | Votes | % | Swing |
| Jack Snelling | ALP | 13,734 | 66.2 | -9.5 |
| Kerry Faggotter | LIB | 6,997 | 33.8 | +9.5 |
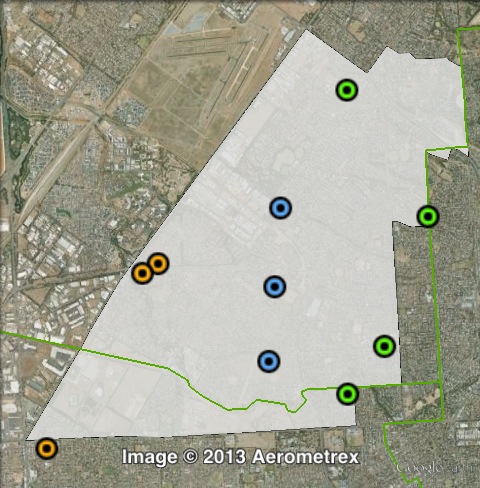
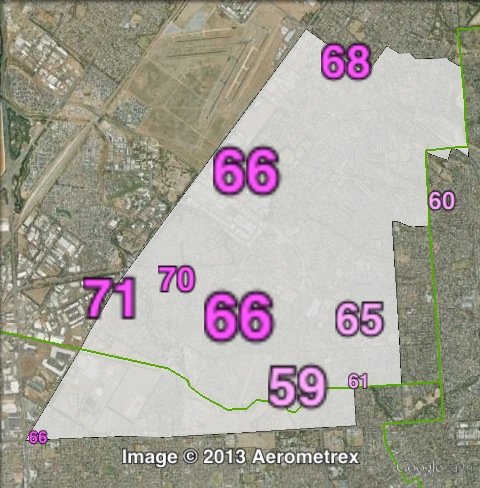
Booth breakdown
Booths have been divided into three areas: central, east and west.
The ALP won a majority in all three areas, ranging from 63.9% in the centre to 69.% in the west.
Family First came third, with a vote ranging from 6.9% in the centre to 5.8% in the west. The Greens came fourth, and did not outpoll Family First in any of the three areas.
| Voter group | FF % | GRN % | ALP 2PP % | Total votes | % of ordinary votes |
| Central | 6.88 | 5.28 | 63.91 | 7,257 | 43.66 |
| East | 6.49 | 4.86 | 64.47 | 5,392 | 32.44 |
| West | 5.76 | 4.76 | 69.87 | 3,973 | 23.90 |
| Other votes | 6.60 | 6.84 | 64.78 | 4,108 |
My prediction: Labor retain.
[Deleted – not relevant]
Which Playford are you talking about Mr. Jackson? There were five Thomas Playfords, two of whom served as Premier of SA (II and IV).
[Deleted – not relevant]