NAT 28.8%
Incumbent MP
Leslie Williams, since 2011.
Geography
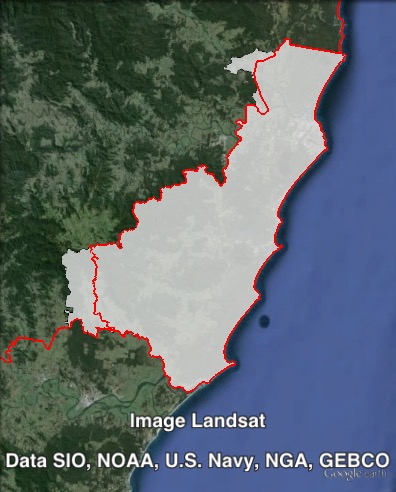
Mid-north coast. Port Macquarie covers the town of Port Macquarie itself, as well as coastal areas in Port Macquarie-Hastings Council, and a northeastern corner of Greater Taree Council. Port Macquarie covers the towns of Port Macquarie, Dunbogan, Kendall, Kew, Laurieton, North Haven, West Haven, Coopernook, Lansdowne, Moorland, Hannam Vale, Johns River and Stewarts River.
Redistribution
Port Macquarie expanded west to take in Telegraph Point and Upper Lansdowne from Oxley. These changes slightly increased the Nationals margin from 28.7% to 28.8%.
History
The electoral district of Port Macquarie has existed since 1988. It was won by the Nationals at every election from 1988 to 1999. In 2002, the sitting Nationals MP left the party, and it was won by independents from 2003 until the Nationals won the seat back in 2011.
The seat was first won in 1988 by Bruce Jeffery of the Nationals. He had been elected to the seat of Oxley in 1984, but it was abolished in 1988. The 1991 redistribution restored the seat of Oxley, and Jeffery returned to his original seat. He held the seat until his retirement in 1999.
Nationals MP Wendy Machin won Port Macquarie in 1991. She had first won the seat of Gloucester in 1985. She moved to the new seat of Manning in 1988 when Gloucester was abolished. Manning was itself abolished in 1991.
Machin was appointed as a minister in the Coalition government in 1993, and was re-elected to Port Macquarie in 1995, when the Coalition lost power. She retired in 1996. She now serves as president of the NRMA Board.
The 1996 by-election was won by the Nationals’ Rob Oakeshott. He was appointed a shadow minister in the Liberal-National opposition after the 1999 election.
During his second term he became disenchanted with the Nationals, finding significant differences between his ideology and Nationals policies.
Oakeshott resigned from the National Party in 2002. He was re-elected as an independent at the 2003 election with almost 70% of the primary vote and 82.8% of the two-party-preferred vote. He was re-elected in 2007 with a slightly smaller margin of 78%.
Following the 2007 federal election, Nationals leader Mark Vaile resigned from his seat of Lyne in 2008, which overlaps with the state seat of Port Macquarie. Oakeshott resigned from Port Macquarie to contest the federal Lyne by-election. He won the seat with a 73.9% margin, which was cut to 62.7% in 2010. Following the 2010 election, Oakeshott and fellow crossbenchers Tony Windsor, Adam Bandt and Andrew Wilkie decided to support a minority Labor government in the hung parliament.
Following Oakeshott’s resignation, a state by-election was also held in Port Macquarie in 2008. The seat was won by independent Peter Besseling. He won with 54.5% of the two-party-preferred vote over the Nationals candidate. He was one of eight independent candidates, polling just under 36% of the primary vote.
In 2011, Besseling was defeated by Nationals candidate Leslie Williams, with a 35% two-candidate-preferred swing since Oakeshott last won the seat in 2007.
Candidates
- Ashley Prinable (Christian Democratic Party)
- Leslie Williams (Nationals)
- Paul Grasso (No Land Tax)
- Kristy Quill (Labor)
- Drusi Megget (Greens)
Assessment
Barring a strong independent challenge, Port Macquarie is a safe Nationals seat.
2011 election result
| Candidate | Party | Votes | % | Swing | Redist |
| Leslie Williams | Nationals | 23,718 | 52.2 | +32.7 | 52.4 |
| Peter Besseling | Independent | 16,601 | 36.5 | -30.6 | 36.0 |
| Peter Alley | Labor | 2,573 | 5.7 | -3.5 | 5.7 |
| Drusi Megget | Greens | 1,651 | 3.6 | +0.9 | 3.7 |
| Robert Waldron | Christian Democrats | 937 | 2.1 | +2.1 | 2.1 |
| Others | 0.2 |
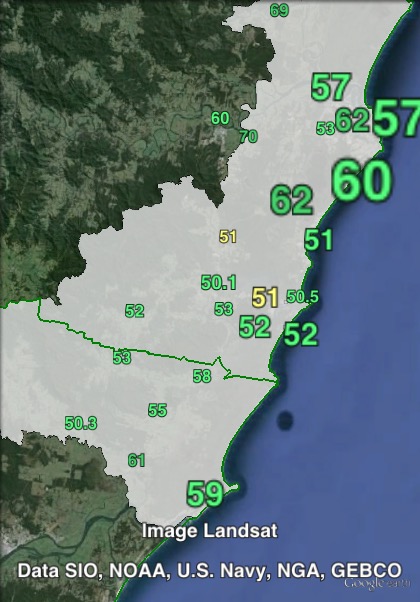
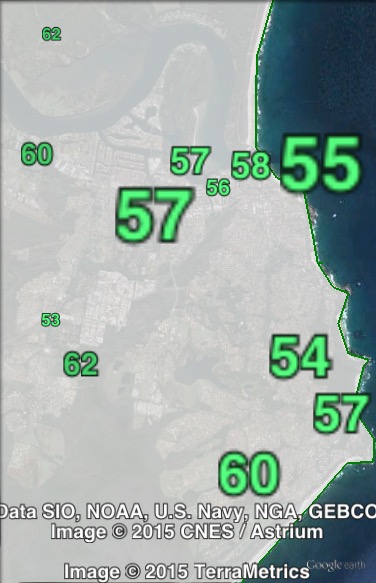
2011 two-candidate-preferred result
| Candidate | Party | Votes | % | Swing |
| Leslie Williams | Nationals | 24,378 | 56.5 | +34.7 |
| Peter Besseling | Independent | 18,774 | 43.5 | -34.7 |
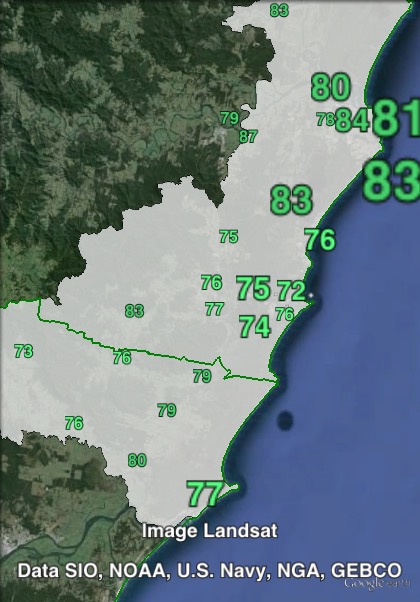
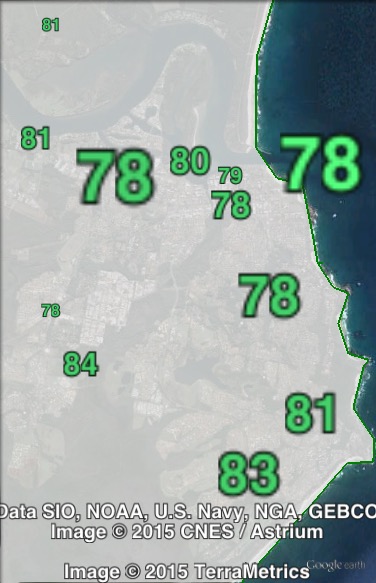
2011 two-party-preferred result
| Candidate | Party | Votes | % | Swing | Redist |
| Leslie Williams | Nationals | 26,830 | 78.7 | +15.8 | 78.8 |
| Peter Alley | Labor | 7,242 | 21.3 | -15.8 | 21.2 |
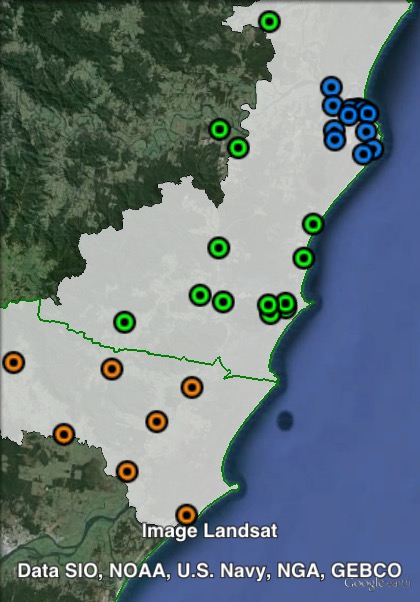
Booth breakdown
Booths in Port Macquarie have been split into three parts. Those polling places in the Port Macquarie urban area have been grouped, and the voters in this area make up a majority of the electorate. Rural booths were split between those in the Port Macquarie-Hastings council area as ‘Central’ and those in the Greater Taree council area as ‘South’.
The Nationals won a majority of the primary vote in all three areas, ranging from 51.6% in Central to 53.2% in Port Macquarie.
Independent candidate Peter Besseling’s vote ranged from 34.1% in the south to 35.9% in the other two parts.
| Voter group | NAT % | IND % | ALP % | Total | % of votes |
| Port Macquarie | 53.2 | 35.9 | 5.2 | 19,748 | 42.8 |
| Central | 51.6 | 35.9 | 6.4 | 9,863 | 21.4 |
| South | 52.0 | 34.1 | 7.3 | 2,917 | 6.3 |
| Other votes | 51.8 | 36.5 | 5.7 | 13,637 | 29.5 |
My prediction: Easy National hold, particularly with the absence of Peter Besseling.