NAT 48.56% vs LAB
Incumbent MP
Simon Bridges, since 2008.
Other local MPs
Brendan Horan (Independent, previously New Zealand First), list MP since 2011.
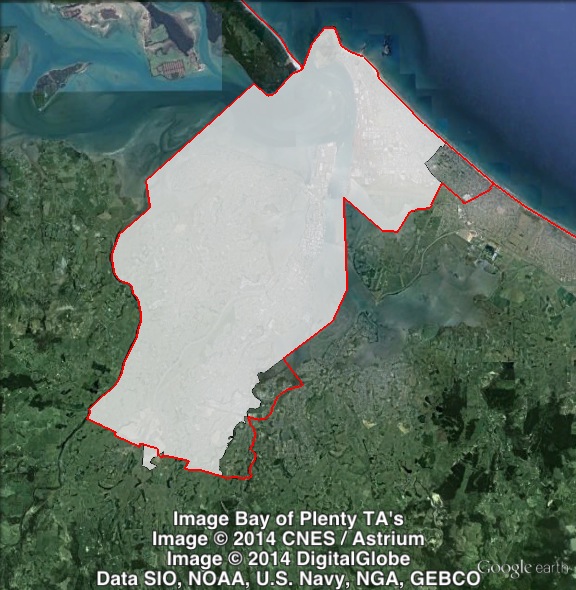
Geography
North Island. Tauranga covers the urban centre of the Tauranga council area, including the suburbs of Bethlehem, Mt Maunganui and Tauranga.
Redistribution
Tauranga’s eastern and southern boundaries with the neighbouring Bay of Plenty seat were slightly adjusted, which increased the National margin from 48.3% to 48.6%.
History
Tauranga has existed continuously since 1908, and shares a name with a previous electorate that existed from 1881 to 1890. The seat was held by the National Party for over fifty years before its sitting member Winston Peters founded New Zealand First in the early 1990s. National won the seat back in 2005.
Two consecutive MPs representing the conservative Reform Party held Tauranga from its creation in 1908 until 1935. In 1935, Labour won the seat off the Reform Party, and three years later the seat was won by the National Party, which was the successor of the Reform Party.
Three successive National Party MPs held Tauranga from 1938 to 1984: Frederick Doldge, George Walsh and Keith Allen. Allen, a minister in the Muldoon National government, retired at the 1984 election, and died shortly after the election.
Tauranga was won in 1984 by the National Party’s Winston Peters, who had previously held Hunua for one term from 1978 to 1981.
Peters was promoted to the National frontbench in 1987 and joined the cabinet when National won power in 1990. Peters was regularly outspoken against his party, and was sacked from cabinet in 1991.
Peters was refused preselection for Tauranga in late 1992, and in early 1993 he resigned from the party to sit as an independent.
In the lead-up to the 1993 election, Peters founded the New Zealand First party, and was re-elected under that party’s banner in Tauranga. This was only the second election in Tauranga’s history where the National Party or its predecessor did not win the seat. New Zealand First also won a second seat, in Northern Maori.
In 1996, Peters was re-elected in Tauranga and was joined by 16 colleagues elected in the five Maori seats and as list MPs under the new proportional electoral system. His party went into coalition with the National Party and he served as Deputy Prime Minister and Treasurer in the coalition government.
In addition, National candidate Katherine O’Regan was elected as a list MP. O’Regan had held Waipa from 1984 until its abolition in 1996.
NZ First split in 1998 and Peters left the government. At the 1999 election, New Zealand First lost all of the Maori electorates, and overall its vote dropped to under 5%. The party only survived in Parliament thanks to Peters’ re-election in Tauranga, which qualified the party for list seats.
Peters only barely held on in Tauranga in 1999, polling just 0.19% more than the National Party’s Katherine O’Regan, and winning with just over 30% of the vote. O’Regan was not ranked highly enough on the National Party list to return to Parliament. Labour candidate Margaret Wilson was elected on the party list.
NZ First strengthened its position in 2002, winning over 10% of the party vote, and Peters increased his margin to 31.9% in Tauranga. Labour came second in Tauranga, with National’s electorate vote almost halving in a year where the party’s vote collapsed around New Zealand.
Labour list MP Margaret Wilson was elected to a second term as a list MP in 2002. She was elected Speaker in early 2005 and was elected to a third term at that year’s election (without running in Tauranga). In addition, United Future’s Larry Baldock was elected in 2002 after running in Tauranga, but lost his seat in 2005.
In 2005, National candidate Bob Clarkson ran a strong campaign to defeat Winston Peters, and Peters was defeated in Tauranga despite a 31.9% margin. Clarkson increased the National vote by 25.3% to 41.6%. Peters suffered from a 13% swing. New Zealand First won over 5%, so the loss of Tauranga did not result in the loss of any seats. Peters was re-elected as a list MP, and his party went into alliance with the Labour Party, with Peters serving as Minister for Foreign Affairs.
In 2008, Peters again ran in Tauranga. Sitting National MP Bob Clarkson retired after one term, and the National Party ran Simon Bridges. Peters’ position weakened further, with National gaining 15.2% and New Zealand First losing 14.5%. In addition, New Zealand First’s party vote dropped below 5%. Without Peters’ former seat of Tauranga, the party did not qualify for any representation in Parliament. New Zealand First returned to Parliament at the 2011 election, but did not make a serious attempt to win back Tauranga.
In 2011, Bridges was re-elected, and New Zealand First candidate Brendan Moran was elected on the party list. Moran was expelled from New Zealand First in December 2012, and now sits as an independent.
Candidates
- Simon Bridges (National #18), Member for Tauranga.
- Nathaniel Heslop (Conservative)
- Rachel Jones (Labour #25)
- Rusty Kane (Independent)
- Yvette Lamare (Independent)
- James Maxwell (United Future #10)
- Ian McLean (Green #49)
- Clayton Mitchell (New Zealand First #6)
- Michael O’Neill (Independent Coalition #2)
- Verna Ohia-Gate (Māori #15)
- Stuart Pederson (ACT)
Assessment
Tauranga had a history of being a very safe National seat, before the rise of New Zealand First. Throughout the 1990s and early 2000s, the seat served as a ‘lifeline’ for New Zealand First, ensuring the party would qualify for seats if their vote fell below 5%. The impact of New Zealand First taking a large proportion of the National vote made Labour a viable challenger for this seat on at least one occasion, in 1999.
After losing in 2005, and failing to win the seat back in 2008, Peters seems to have given up any ambition to win back Tauranga. His party’s candidate for the seat is not one of the party’s seven MPs, and Peters has made threats about running in other electorates.
Tauranga seems set to stay with National for the foreseeable future, absent a poor National showing and a strong New Zealand First showing at some future election. Bridges should have no trouble winning a third term in 2014.
2011 election results
| Electorate Votes | Party Votes | ||||||||
| Candidate | Party | Votes | % | Swing | Redist | Votes | % | Swing | Redist |
| Simon Bridges | National | 21,971 | 61.40 | +4.59 | 61.62 | 19,858 | 54.23 | -0.08 | 54.48 |
| Deborah Mahuta-Coyle | Labour | 4,707 | 13.15 | +5.45 | 13.06 | 5,496 | 15.01 | -7.61 | 14.86 |
| Brendan Horan | New Zealand First | 4,611 | 12.88 | -12.24 | 12.88 | 5,455 | 14.90 | +4.78 | 14.91 |
| Ian McLean | Green | 2,458 | 6.87 | +2.93 | 6.67 | 3,208 | 8.76 | +4.18 | 8.58 |
| Larry Baldock | Conservative | 1,512 | 4.23 | +4.23 | 4.28 | 1,499 | 4.09 | +4.09 | 4.18 |
| Kath McCabe | ACT | 190 | 0.53 | -0.05 | 0.54 | 426 | 1.16 | -1.73 | 1.16 |
| Awanui Black | Māori | 123 | 0.34 | +0.34 | 0.35 | 182 | 0.50 | -0.07 | 0.51 |
| Jayson Gardiner | Mana | 90 | 0.25 | +0.25 | 0.24 | 59 | 0.16 | +0.16 | 0.16 |
| Katherine Ransom | Democrats | 63 | 0.18 | +0.09 | 0.18 | 22 | 0.06 | -0.01 | 0.06 |
| Yvette Lamare | Independent | 61 | 0.17 | +0.17 | 0.17 | ||||
| United Future | 205 | 0.56 | -0.12 | 0.56 | |||||
| Legalise Cannabis | 184 | 0.50 | +0.13 | 0.49 | |||||
| Libertarianz | 18 | 0.05 | -0.01 | 0.04 | |||||
| Alliance | 8 | 0.02 | -0.02 | 0.02 | |||||
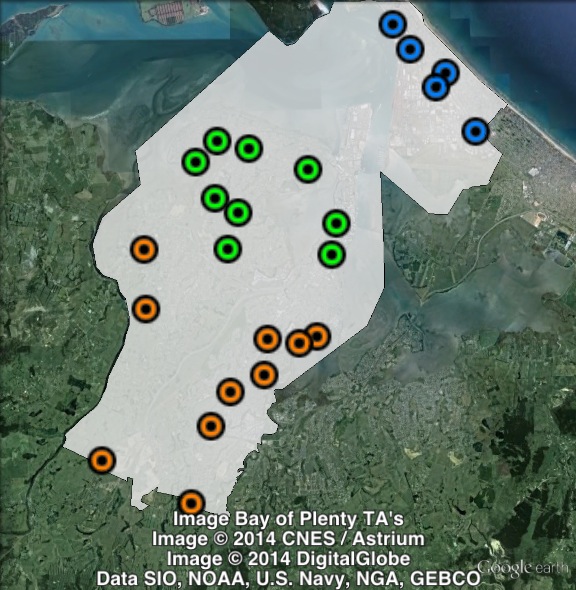
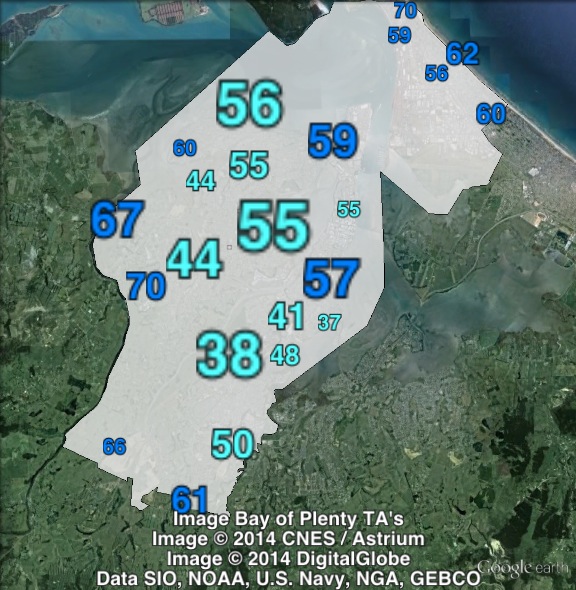
Booth breakdown
Booths in Tauranga have been divided into three parts: South, Central and North. The ‘North’ area covers the polling places in Mount Maunganui.
National’s electorate vote ranged from 58.5% in the south to 67% in the north, while their party vote ranged from 51.8% in the south to 61% in the north.
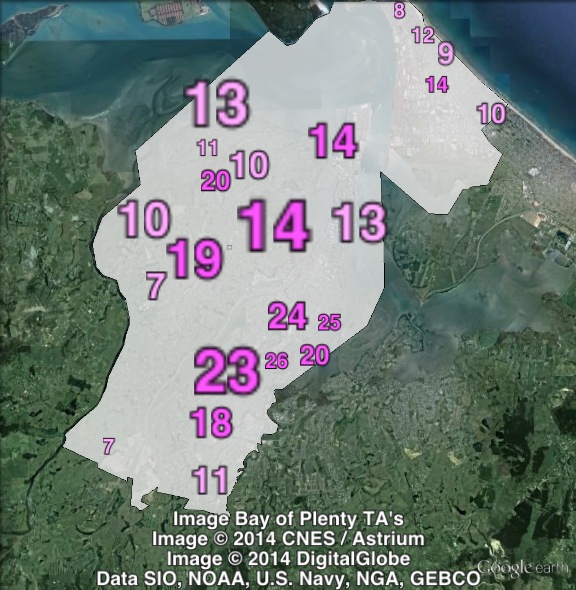
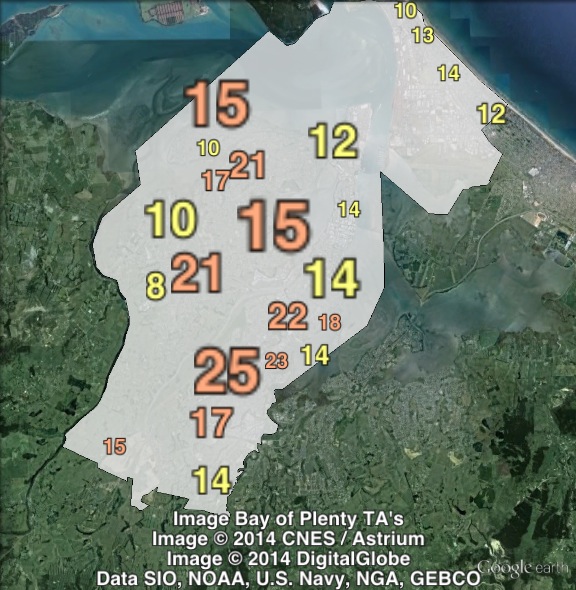
Labour and New Zealand First polled a roughly similar vote, around 13-15% of the electorate vote and 14-17% of the party vote. Labour outpolled New Zealand First in South, while New Zealand First performed better in Central and North. Both parties polled their lowest vote in the north, which was the best area for the Green Party.
| Voter group | Electorate votes | Party votes | Total | % of votes | |||||
| NAT | LAB | NZF | NAT | LAB | NZF | GRN | |||
| Central | 61.16 | 12.94 | 13.66 | 53.68 | 14.40 | 15.84 | 8.89 | 11,982 | 35.20 |
| South | 58.51 | 14.61 | 14.21 | 51.82 | 16.97 | 16.55 | 6.71 | 10,393 | 30.53 |
| North | 66.96 | 9.45 | 9.74 | 61.11 | 10.33 | 11.31 | 11.26 | 3,408 | 10.01 |
| Other votes | 64.01 | 12.80 | 11.36 | 56.18 | 14.72 | 13.05 | 9.34 | 8,257 | 24.26 |