LAB 37.61% vs MAORI
Incumbent MP
Meka Whaitiri, since 2013.
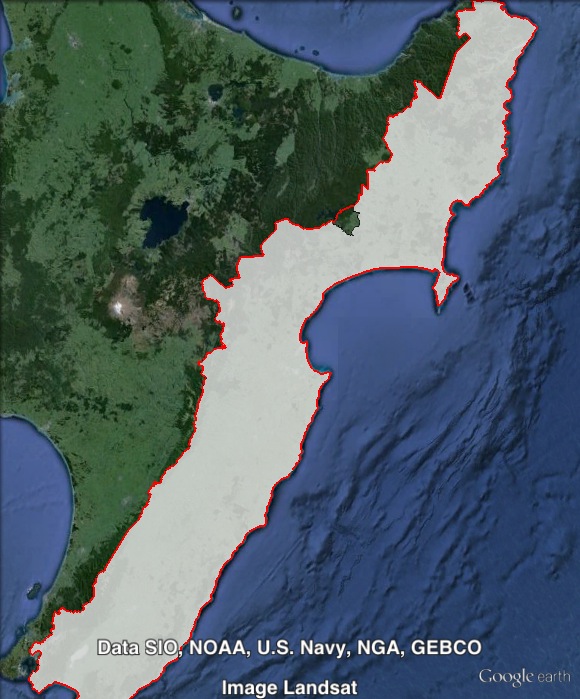
Geography
East Coast of North Island. Ikaroa-Rāwhiti stretches along the east coast from the Upper Hutt Valley in the suburbs of Wellington, through the Wairarapa and Hawke’s Bay regions to the north-eastern tip of the Gisborne council area. The main urban centres are Napier, Hastings, Gisborne and Upper Hutt.
Redistribution
A very small change was made to Ikaroa-Rāwhiti’s boundaries, losing the area around Tuai to Waiariki. This area contains a very small number of Māori voters. This change was the only change to the Māori electoral boundaries in the most recent redistribution.
History
The electorate of Ikaroa-Rāwhiti was created in the 1999 election, replacing the electorate of Te Tai Rawhiti, which had existed for one term. Prior to the 1996 redistribution, most of the area was covered by the electorate of Eastern Maori, which had been held by Labour since 1946.
Labour’s Peter Tapsell won Eastern Maori in 1981. Three previous Labour MPs had held the electorate from 1943 to 1981. Tapsell was re-elected in 1984, 1987, 1990 and 1993. After the 1993 election, he was elected as Speaker.
In 1996, the renamed seat of Te Tai Rawhiti was won by New Zealand First’s Tuariki Delamere, who defeated Labour’s Peter Tapsell.
Delamere served as a minister in the National-led government. In 1998, New Zealand First split, with Delamere continuing to serve as a minister and support the government while the party moved to the crossbenches. Delamere joined the small Te Tawharau party.
In 1999, Te Tai Rawhiti was broken up, and Delamere ran in the new Waiariki electorate, coming second with 20% of the vote.
In Ikaroa-Rāwhiti in 1999, Labour’s Parekura Horomia won narrowly, with 41%. Independent candidate Derek Fox came second with 37.2%.
Horomia was re-elected in 2002, 2005, 2008 and 2011.
In 2002, Horomia won 60% of the vote, 47.7% ahead of the New Zealand First candidate.
In 2005, Horomia faced much stronger competition from the newly-formed Māori Party. Horomia’s vote dropped to 53.8%, 11% ahead of the Māori candidate. Horomia held on with a 9.5% margin in 2008.
In 2011, Horomia increased his margin substantially to 37.6%.
Horomia died in April 2013, triggering a by-election in Ikaroa-Rāwhiti.
The 2013 by-election was won by Labour’s Meka Whaitiri, with 40.9% of the vote.
Candidates
- Cathryn Eden (Independent)
- Marama Fox (Māori #2)
- Henare Kani (Green #46)
- Te Hāmua Nikora (Mana #7)
- Vicky Rose (Expats)
- Meka Whaitiri (Labour #19)
Assessment
Māori electorates tend to be very unpredictable and can produce unexpected results, but Ikaroa-Rāwhiti is a very safe Labour seat and that is unlikely to change in 2014.
2011 election results
| Electorate Votes | Party Votes | ||||||||
| Candidate | Party | Votes | % | Swing | Redist | Votes | % | Swing | Redist |
| Parekura Horomia | Labour | 10,558 | 60.71 | +9.22 | 60.67 | 9,054 | 49.58 | -7.62 | 49.59 |
| Na Raihania | Māori | 4,017 | 23.10 | -19.86 | 23.13 | 2,736 | 14.98 | -11.91 | 14.98 |
| Tawhai McClutchie | Mana | 2,484 | 14.28 | +14.28 | 14.28 | 1,754 | 9.60 | +9.6 | 9.61 |
| Maurice Wairau | Independent | 332 | 1.91 | +1.91 | 1.91 | ||||
| Green | 1,710 | 9.36 | +6.21 | 9.37 | |||||
| New Zealand First | 1,516 | 8.30 | +2.93 | 8.28 | |||||
| National | 1,091 | 5.97 | +1.12 | 5.98 | |||||
| Legalise Cannabis | 267 | 1.46 | +0.47 | 1.46 | |||||
| Conservative | 73 | 0.40 | +0.4 | 0.40 | |||||
| ACT | 36 | 0.20 | -0.04 | 0.20 | |||||
| United Future | 14 | 0.08 | -0.01 | 0.08 | |||||
| Libertarianz | 7 | 0.04 | +0.02 | 0.04 | |||||
| Alliance | 2 | 0.01 | 0.00 | 0.01 | |||||
| Democrats | 2 | 0.01 | 0.00 | 0.01 | |||||
2013 by-election results
| Candidate | Party | Votes | % | Swing |
| Meka Whaitiri | Labour | 4,590 | 40.90 | -19.81 |
| Te Hamua Nikora | Mana | 2,931 | 26.12 | +11.84 |
| Na Raihania | Māori | 2,229 | 19.86 | -3.24 |
| Marama Davidson | Green | 1,251 | 11.15 | – |
| Michael Appleby | Legalise Cannabis | 176 | 1.57 | – |
| Maurice Wairau | Independent | 30 | 0.27 | -1.64 |
| Adam Holland | Independent | 15 | 0.13 | – |
Booth breakdown
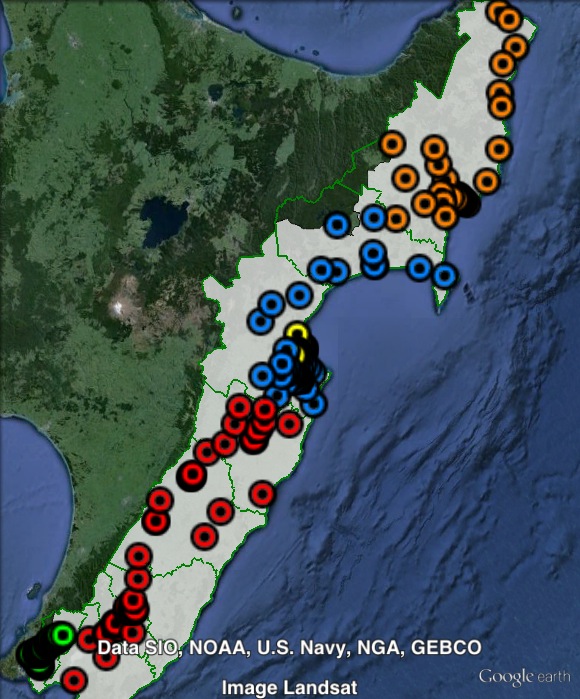
Booths in Ikaroa-Rāwhiti have been divided into five areas. Each area is contained in one or a number of council areas.
The ‘Gisborne’ and ‘Napier’ areas cover a single council area of the same name.
The ‘Central’ area covers Hastings and Wairoa council areas.
The ‘Hutt Valley’ area covers Lower Hutt and Upper Hutt council areas in the Wellington suburbs.
The ‘Wairarapa’ area covers Carterton, Central Hawke’s Bay, Masterton, South Wairarapa and Tararua council areas.
2011 election breakdown
In 2011, Labour won a majority of the electorate vote in all five areas, ranging from 55.8% in Central to 65.2% in Gisborne.
The Māori Party came second in all five areas, with a vote ranging from 18.4% in Gisborne to 27.5% in Wairarapa. The Mana Party’s vote ranged from 11.8% in Napier to 15.4% in Central.
Labour topped the party vote in every area, winning a majority in two areas and a large plurality in the other three areas. The Labour vote ranged from 42.5% in Wairarapa to 56.7% in Napier.
The Maori Party outpolled the Mana Party on the party vote in all five areas, with a vote ranging from 12.5% in Gisborne to 18.2% in Central. The Mana vote ranged from 7.3% in Napier to 11.1% in Central. The Green Party vote peaked at 11.6% in Gisborne. The Green Party outpolled Mana in Gisborne, Hutt Valley, Napier and Wairarapa.
| Voter group | Electorate votes | Party votes | Total | % of votes | |||||
| LAB | MAORI | MANA | LAB | MAORI | MANA | GRN | |||
| Gisborne | 65.19 | 18.39 | 15.10 | 49.05 | 12.48 | 10.19 | 11.63 | 4,502 | 25.89 |
| Central | 55.75 | 27.19 | 15.44 | 48.41 | 18.18 | 11.12 | 7.79 | 4,461 | 25.65 |
| Hutt Valley | 62.99 | 21.41 | 13.32 | 52.82 | 12.99 | 7.60 | 8.20 | 2,756 | 15.85 |
| Napier | 64.18 | 22.13 | 11.78 | 56.67 | 14.70 | 7.28 | 7.61 | 2,038 | 11.72 |
| Wairarapa | 57.37 | 27.46 | 11.92 | 42.52 | 17.26 | 8.26 | 9.77 | 1,846 | 10.61 |
| Other votes | 57.77 | 23.94 | 16.11 | 48.48 | 14.32 | 11.10 | 10.70 | 1,788 | 10.28 |
2013 by-election breakdown
The Labour Party topped the poll at the 2013 by-election in all five areas, with a vote ranging from 36.6% in Gisborne to 45.6% in Napier.
The Mana Party came second in two out of five areas: Gisborne and Hutt Valley. The Mana vote ranged from 14.6% in Wairarapa to 28.9% in Gisborne.
The Māori Party came second in Central, Napier and Wairarapa. The Māori Party vote ranged from 16.4% in Hutt Valley to 26.1% in Central.
The Green Party came fourth, with a vote ranging from 8% in Central to 16% in Gisborne.
| Voter group | LAB | MANA | MAORI | GRN | Total | % of votes |
| Central | 43.00 | 20.99 | 26.12 | 8.02 | 2,358 | 21.01 |
| Gisborne | 36.58 | 28.93 | 16.42 | 15.98 | 2,966 | 26.43 |
| Hutt Valley | 43.96 | 25.74 | 16.36 | 12.17 | 1,076 | 9.59 |
| Napier | 45.64 | 20.28 | 22.24 | 10.41 | 1,124 | 10.02 |
| Wairarapa | 48.28 | 14.57 | 22.16 | 12.28 | 961 | 8.56 |
| Other votes | 38.03 | 34.09 | 17.79 | 8.11 | 2,737 | 24.39 |
image