LAB 35.53% vs MANA
Incumbent MP
Nanaia Mahuta, since 2008. Previously list MP 1996-1999, Member for Te Tai Hauāuru 1999-2002, Member for Tainui 2002-2008.
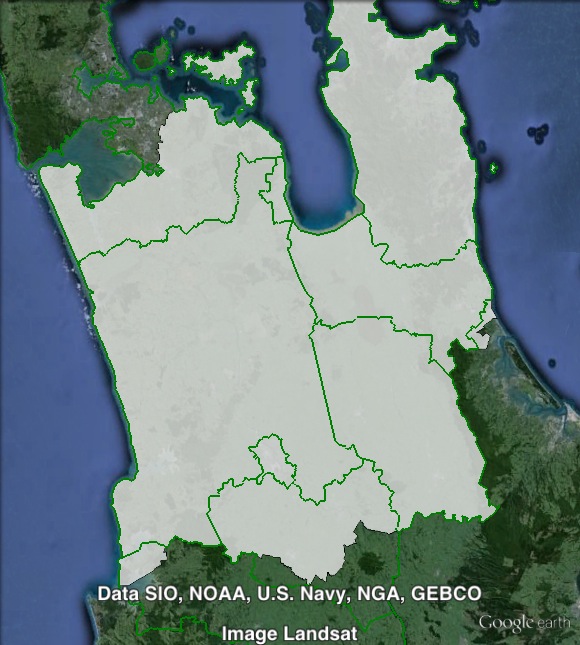
Geography
North Island. Hauraki-Waikato covers a large part of the North Island immediately to the south of Auckland. The electorate includes the Coromandel peninsula, the Waikato region and the city of Hamilton. The electorate’s northern border reaches, but does not include, the southeastern edge of the Auckland urban area. The largest town in the electorate is Hamilton, but the seat also covers Thames, Matamata, Te Awamutu and Papakura.
Redistribution
No change.
History
The electorate of Hauraki-Waikato has existed by its current name since 2008, but it follows in the line of a number of previous electorates covering rural areas immediately to the south of Auckland.
The 1996 election created the electorate of Te Tai Hauāuru, which at the time largely covered the Hauraki-Waikato area. The electorate was won by New Zealand First’s Tuku Morgan. Labour’s Nanaia Mahuta missed out, but was elected on the party list.
Morgan resigned from New Zealand First during his term, and helped form Mauri Pacific. In 1999, he lost to Labour’s Nanaia Mahuta. In 1999, Te Tai Hauāuru shifted southward, with the new electorate of Tamaki Makaurau covering much of the area now covered by Hauraki-Waikato, as well as most of Auckland.
In 2002, yet another electorate was created in the area, called Tainui. Te Tai Hauāuru shifted even further south, and Tamaki Makaurau retreated back to largely cover the Auckland urban area. At that year’s election Nanaia Mahuta shifted to cover the new electorate. Mahuta won the seat with a 23.7% margin over the Alliance candidate.
The Māori Party was formed before the 2005 election. In Tainui, Mahuta held on comfortably, with a 28% margin over her Māori Party challenger.
In 2008, Tainui was replaced by Hauraki-Waikato. In the newly-named electorate, Mahuta faced only one challenger, the Māori Party’s Angeline Greensill. Mahuta narrowly held on with 52.5% of the vote.
In 2011, Mahuta was re-elected with an increased 58.4% vote. The Māori Party vote was split, with Greensill running for the Mana Party. The split vote meant that Mahuta increased her majority to 35.5% over the Mana Party.
Candidates
- Susan Cullen (Māori)
- Angeline Greensill (Mana #11)
- Nanaia Mahuta (Labour #6)
Assessment
Māori electorates tend to be very unpredictable and can produce unexpected results, but Hauraki-Waikato is a very safe Labour seat and that is unlikely to change in 2014.
2011 election results
| Electorate Votes | Party Votes | ||||||
| Candidate | Party | Votes | % | Swing | Votes | % | Swing |
| Nanaia Mahuta | Labour | 9,751 | 58.38 | +5.88 | 8,250 | 46.11 | -6.45 |
| Angeline Greensill | Mana | 3,816 | 22.84 | +22.84 | 2,007 | 11.22 | +11.22 |
| Tau Bruce Mataki | Māori | 2,899 | 17.36 | -30.15 | 2,337 | 13.06 | -14.62 |
| Te Ariki Karamaene | Nga Iwi | 238 | 1.42 | +1.42 | |||
| New Zealand First | 1,758 | 9.83 | +4.36 | ||||
| Green | 1,634 | 9.13 | +5.9 | ||||
| National | 1,491 | 8.33 | +1.12 | ||||
| Legalise Cannabis | 258 | 1.44 | +0.18 | ||||
| Conservative | 76 | 0.42 | +0.42 | ||||
| ACT | 37 | 0.21 | -0.40 | ||||
| United Future | 33 | 0.18 | +0.01 | ||||
| Libertarianz | 8 | 0.04 | +0.01 | ||||
| Alliance | 2 | 0.01 | +0 | ||||
| Democrats | 2 | 0.01 | +0 | ||||
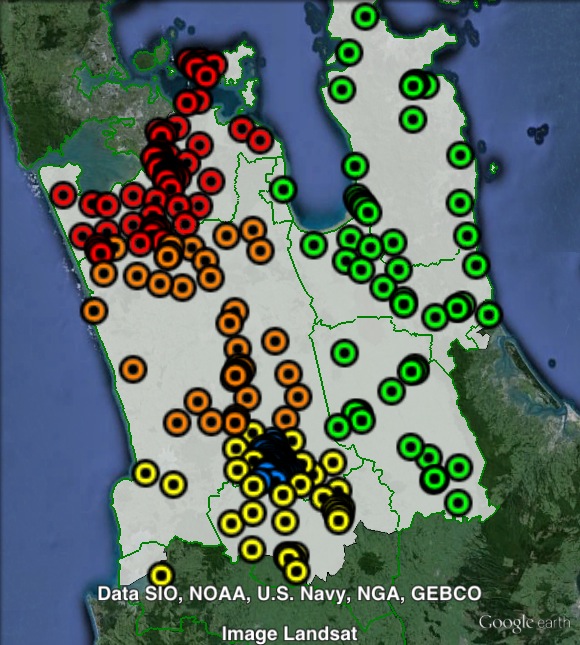
Booth breakdown
Booths in Hauraki-Waikato have been divided into five areas.
- Central – Waikato council area, north of Hamilton.
- East – Hauraki, Matamata-Piako, Thames-Coromandel and Western Bay of Plenty council areas.
- Hamilton – City of Hamilton
- North – Auckland Region
- South – Otorohanga and Waipa council areas, and parts of Waikato council area to the east, west and south of Hamilton.
Labour won a majority of the electorate vote in all five areas. In Central, Labour won a huge 71% vote. In the other four areas, the Labour electorate vote ranged from 52.2% in South to 59.8% in Hamilton.
The Mana Party electorate vote ranged from 17.7% in Central to 28.4% in the South. The Māori Party electorate vote ranged from 10.2% in Central to 22.7% in the North. The Māori Party outpolled the Mana Party in the North, while the Mana Party came second in the other four areas.
Labour’s party vote ranged from 39.2% in the South to 54.3% in Central. Labour topped the poll in all five areas, with a majority in Central only. The Māori Party came second on the party vote, with Mana Party third, followed by New Zealand First, Green and National.
Apart from Labour, the National Party came second in the South, the Greens came second in the East, and the Māori Party came second in the other three areas.
| Voter group | Electorate votes | Party votes | Total | % of votes | ||||
| LAB | MANA | MAORI | LAB | MAORI | MANA | |||
| Hamilton | 59.77 | 24.37 | 14.66 | 48.21 | 12.28 | 10.68 | 5,376 | 32.18 |
| North | 55.10 | 20.47 | 22.74 | 45.65 | 13.21 | 11.17 | 3,624 | 21.70 |
| Central | 71.13 | 17.70 | 10.23 | 54.33 | 10.64 | 10.19 | 2,345 | 14.04 |
| East | 55.56 | 21.88 | 20.82 | 39.50 | 13.10 | 10.15 | 1,897 | 11.36 |
| South | 52.19 | 28.43 | 17.75 | 39.18 | 16.01 | 10.78 | 1,414 | 8.47 |
| Other votes | 52.78 | 25.98 | 19.58 | 43.75 | 15.00 | 14.43 | 2,048 | 12.26 |