Council margin – LNP 31.0% vs GRN
Mayoral margin – LNP 32.4%
Incumbent councillor
Margaret de Wit, since 1997.
Geography
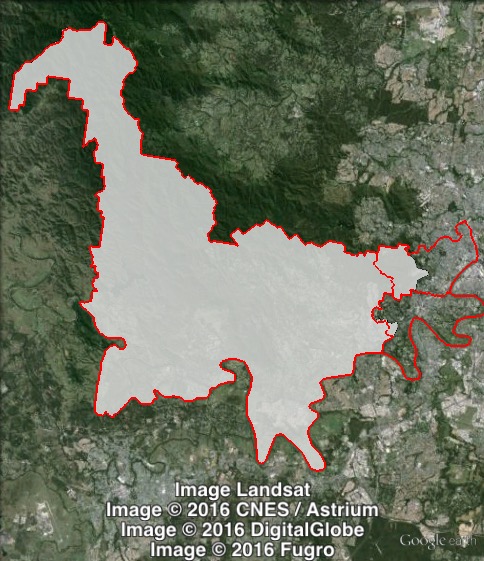
North-western Brisbane. Pullenvale covers a large part of the Brisbane City Council area with little to no population, but most of its population lies in suburbs on north side of the Brisbane River to the west of the city centre, including Kenmore, Bellbowrie and Moggill.
Redistribution
Pullenvale has maintained all of the territory contained in the ward prior to the redistribution, gaining small areas from Walter Taylor and Toowong/Paddington wards. These changes had a minimal impact on the ward’s margins.
History
Pullenvale has been a safe Liberal ward for a long time.
Margaret de Wit has held this ward since 1997. De Wit won with a 17.4% margin in 2000, 29% in 2004, 30.6% in 2008 and 31.2% in 2012 (the last time against the Greens).
de Wit rose to the position of chairman of the council, which she held until she announced her council retirement in 2015.
Candidates
Sitting LNP councillor Margaret de Wit is not running for re-election.
- Kate Richards (Liberal National)
- Catherine Abel (Labor)
- John Belchamber (Greens)
Assessment
Pullenvale is the safest LNP ward in the city.
2012 council result
| Candidate | Party | Votes | % | Swing | Redist |
| Margaret De Wit | Liberal National | 16,802 | 74.8 | +0.8 | 74.8 |
| Grace Johnston | Labor | 2,676 | 11.9 | -3.4 | 13.3 |
| Anne Gardiner | Greens | 2,978 | 13.3 | +2.6 | 11.9 |
| Informal | 357 | 1.6 |
2012 council two-party-preferred result
| Candidate | Party | Votes | % | Swing | Redist |
| Margaret De Wit | Liberal National | 16,972 | 81.2 | 81.0 | |
| Anne Gardiner | Greens | 3,939 | 18.8 | 19.0 | |
| Exhausted | 1,719 |
2012 mayoral result
| Candidate | Party | Votes | % | Swing | Redist |
| Graham Quirk | Liberal National | 16,630 | 74.1 | +0.3 | 74.1 |
| Ray Smith | Labor | 2,797 | 12.5 | -3.8 | 12.5 |
| Andrew Bartlett | Greens | 2,721 | 12.1 | +3.9 | 12.1 |
| Rory Killen | Independent | 173 | 0.8 | +0.8 | 0.8 |
| Chris Carson | Independent | 129 | 0.6 | +0.6 | 0.6 |
| Informal | 355 | 1.6 |
2012 mayoral two-party-preferred result
| Candidate | Party | Votes | % | Swing | Redist |
| Graham Quirk | Liberal National | 17,018 | 82.4 | +2.1 | 82.4 |
| Ray Smith | Labor | 3,642 | 17.6 | -2.1 | 17.6 |
| Exhausted | 1,790 |
Booth breakdown
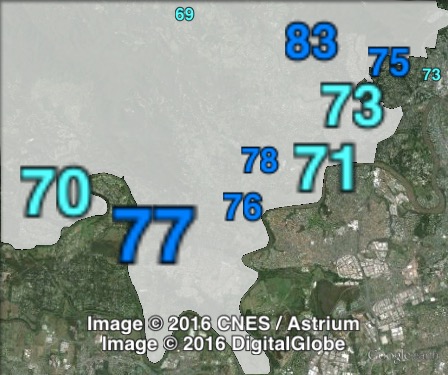
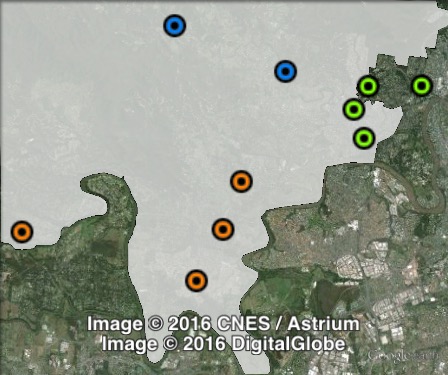
Booths in Pullenvale have been split into three parts: east, north and south. The north covers those booths not near the river.
The LNP’s primary vote ranged from 72.5% in the east, to 80.9% in the north.
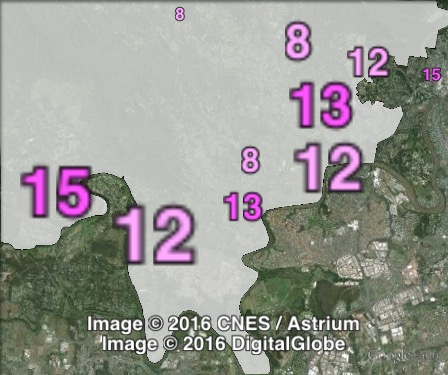
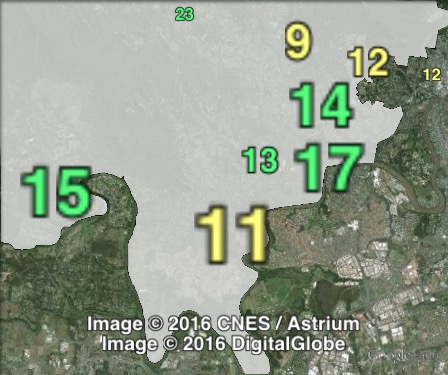
The Greens outpolled Labor in all three areas, ranging from 10.9% in the north to 15% in the east. Labor polled 8% in the north and 12.5% in the east and south.
| Voter group | GRN council | ALP council | LNP council | Total votes | % of votes |
| South | 12.6 | 12.5 | 74.9 | 8,689 | 38.7 |
| East | 15.0 | 12.5 | 72.5 | 6,869 | 30.6 |
| North | 10.9 | 8.1 | 80.9 | 2,351 | 10.5 |
| Other votes | 13.1 | 11.8 | 75.1 | 4,541 | 20.2 |